Datarails for Construction & Real Estate
In construction and real estate, costs change as fast as the projects themselves. Costs fluctuate, timelines shift, and every decision affects your bottom line.
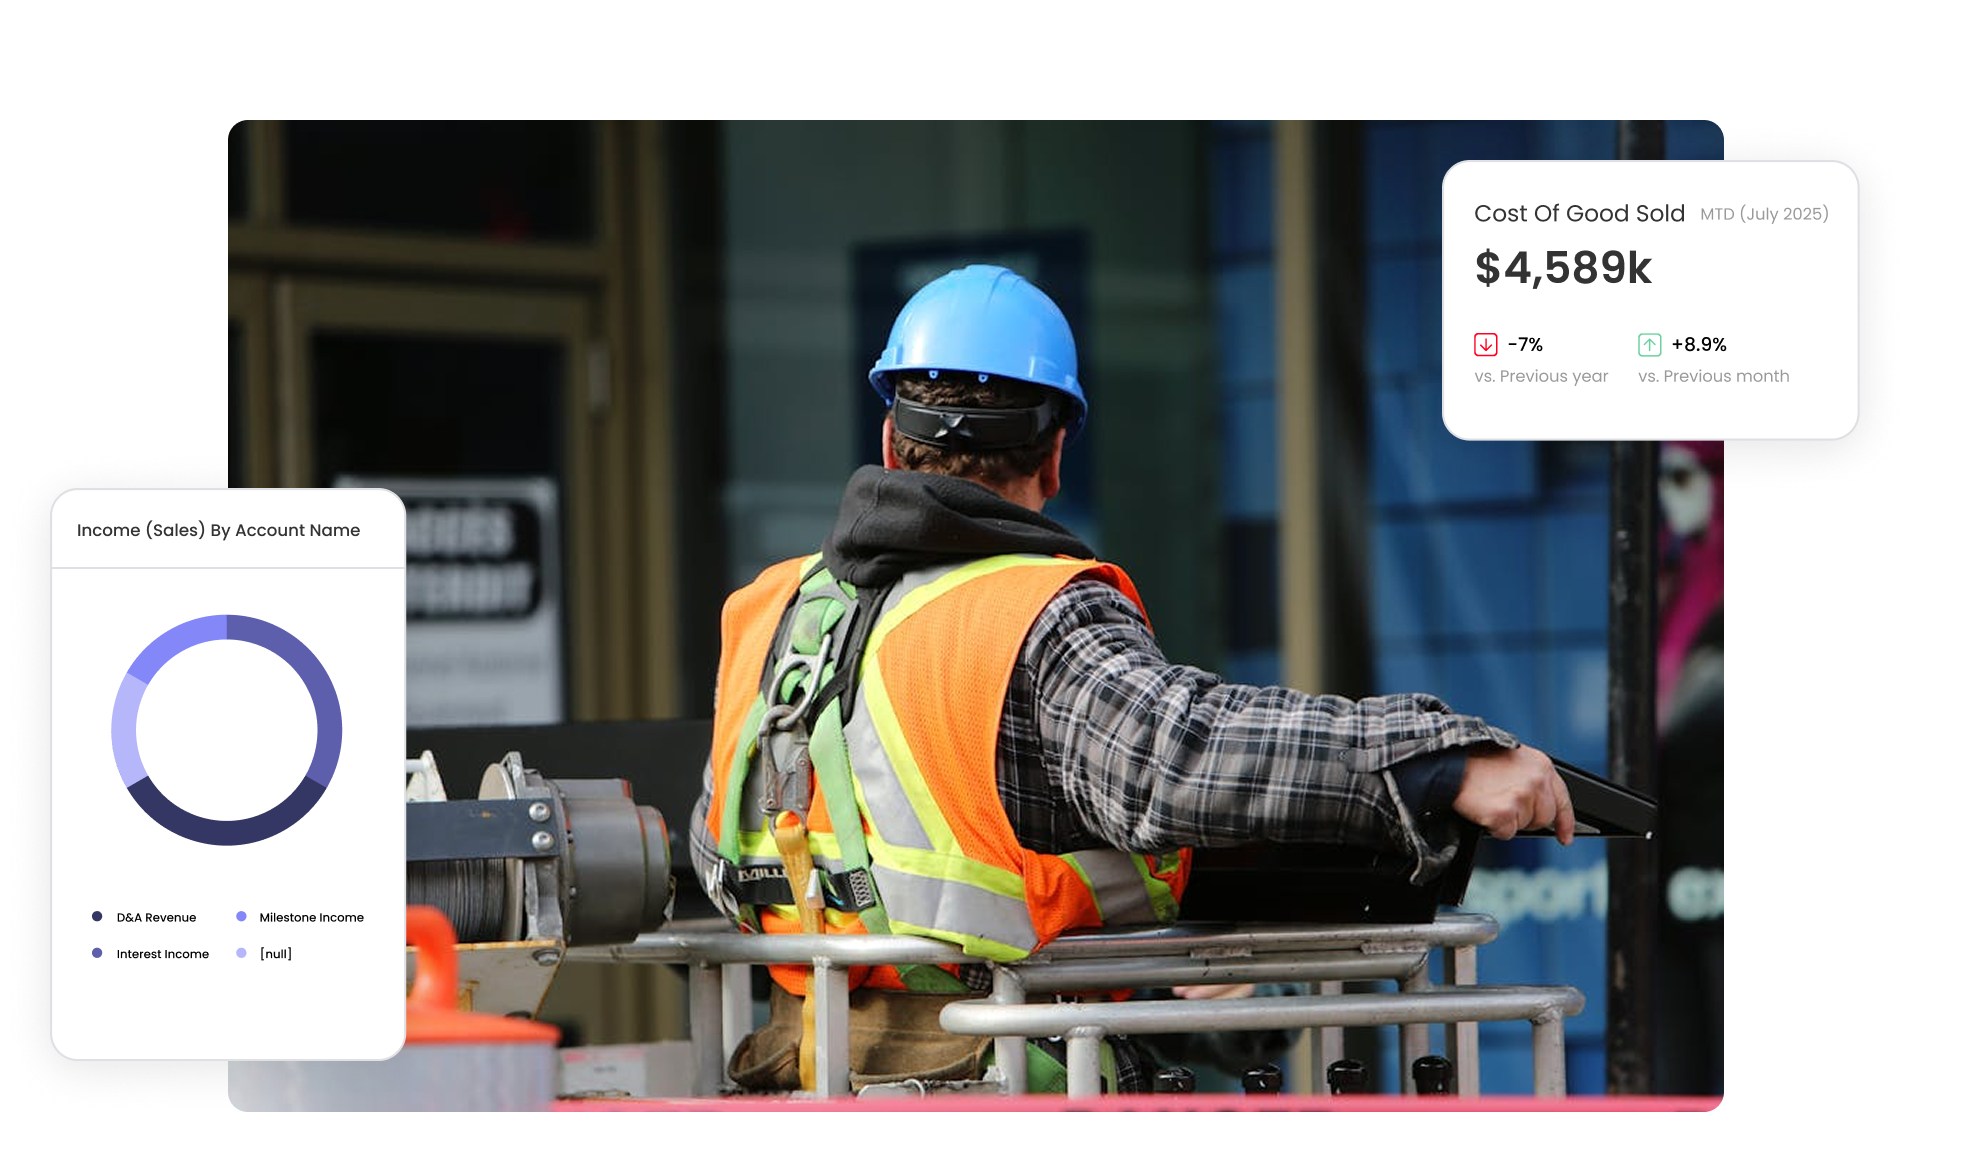
Financial clarity across every project and property
Datarails brings order to the chaos – consolidating your data and automating the manual work so you can report, plan, and make smarter decisions in real time. With clarity in every number, your projects stay on budget and your business stays on solid financial ground.
Complete visibility
Hours back every month
Forecast with confidence
“It’s been helpful, accurate, and easy to use. Datarails made our processes smoother and saved us upwards of 40 hours a month. It’s been a huge benefit, very positive ROI.”


Automated consolidation
Bring every project and property togetherBudgets, labor costs, materials, and capital investments often live in different systems. Datarails connects to your ERP, accounting platform, and project management tools to automatically sync and consolidate your financial data, giving you a single source of truth for every project, portfolio, and entity. With everything connected and updated in real time, you get accurate numbers you can rely on, without manual merges or version control issues.
Read more about our partnership and integration with MRI Software

Cash flow & cost control
Stay ahead of the financial curveIn construction and real estate, timing is everything, especially when it comes to cash. Get a clear and current view of incoming and outgoing cash. Build 13-week cash flow forecasts, track upcoming payments and delays, and monitor cost overruns as they develop. Spot issues early, understand the impact on liquidity, and make adjustments before they affect your bottom line.

Real-time insights & analytics
Turn complex data into actionable insightsFinancial and operational data changes daily, so you need insight that keeps up. Datarails gives you real-time dashboards that track project performance, capital allocation, lease activity, and profitability across entities, all in a clear and easy-to-share format. Use Datarails AI to generate reports and presentations from your data, highlighting trends, anomalies, and emerging risks. Insights stay current, digestible, and ready for any stakeholder.

Forecasting & scenario planning
Plan for every “what-if”Material costs, labor availability, financing terms, and occupancy rates can all change quickly. Build custom models to evaluate how each factor impacts profitability, ROI, and liquidity. Compare scenarios side by side, forecast project timelines, and update assumptions automatically as actuals sync in. With centralized models and automated data flows, planning becomes faster, more accurate, and far easier to share with executives, developers, or partners.
Learn why construction and real estate leaders trust Datarails to streamline reporting, improve forecasting, and manage project costs with confidence.
FAQ
Does Datarails integrate with our ERP and other data sources?
Yes. Datarails connects with 200+ systems and software, as well as 100% of banks globally, allowing you to automatically pull all your financial data.
How secure is the data?
Security is built in. Data is encrypted, access is role-based, and we comply with leading privacy and protection standards.
Is it suitable for builders, developers, and property managers?
Absolutely. Datarails adapts to your structure, whether you manage active job sites, rental portfolios, or multi-entity developments.
Can we keep using Excel?
Yes. Datarails enhances Excel with automation and real-time data syncs. Keep your familiar workflows, without the manual work.
How long does implementation take?
Most teams are up and running within 4–6 weeks. Our onboarding experts handle setup and ensure your reports align with your project and property structures from day one.