Data Visualization and Analysis in Datarails
Finance shouldn’t just report results. It tells the story behind them. With Datarails, you can transform raw numbers into visuals that make trends, variances, and anomalies instantly clear. When data is easy to understand, it’s easier to drive alignment and inspire confident business decisions.
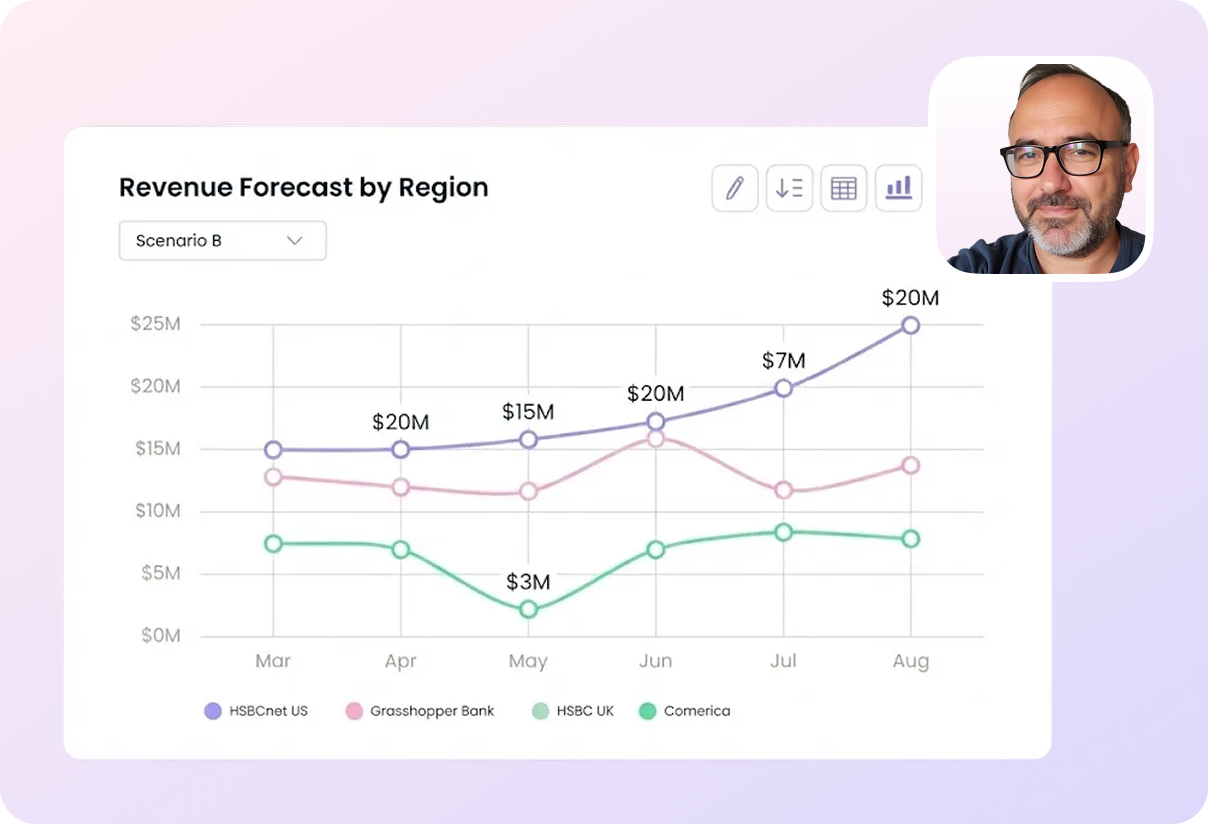
Dashboards that drive impact
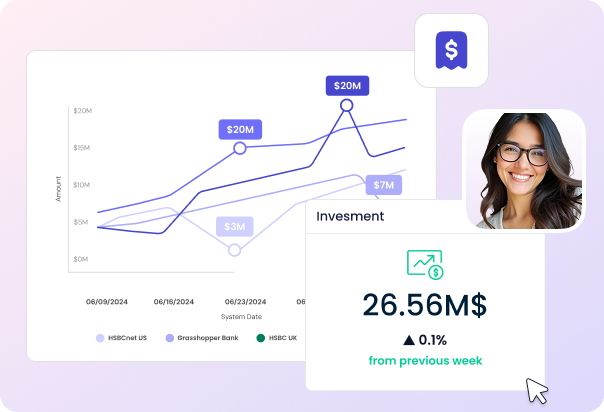
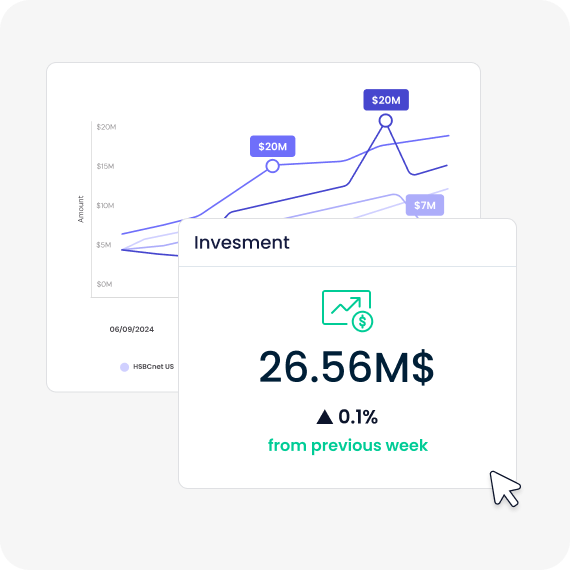
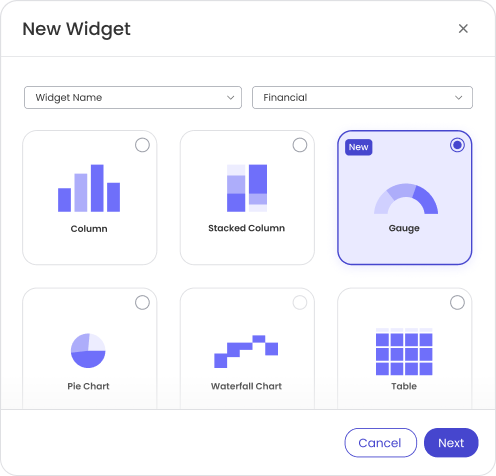
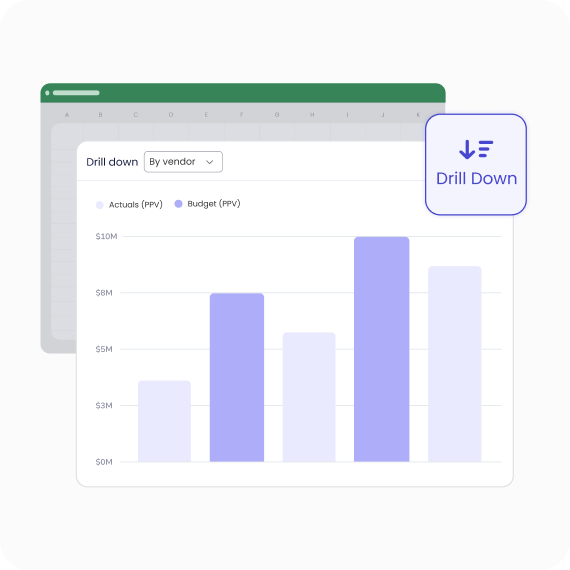
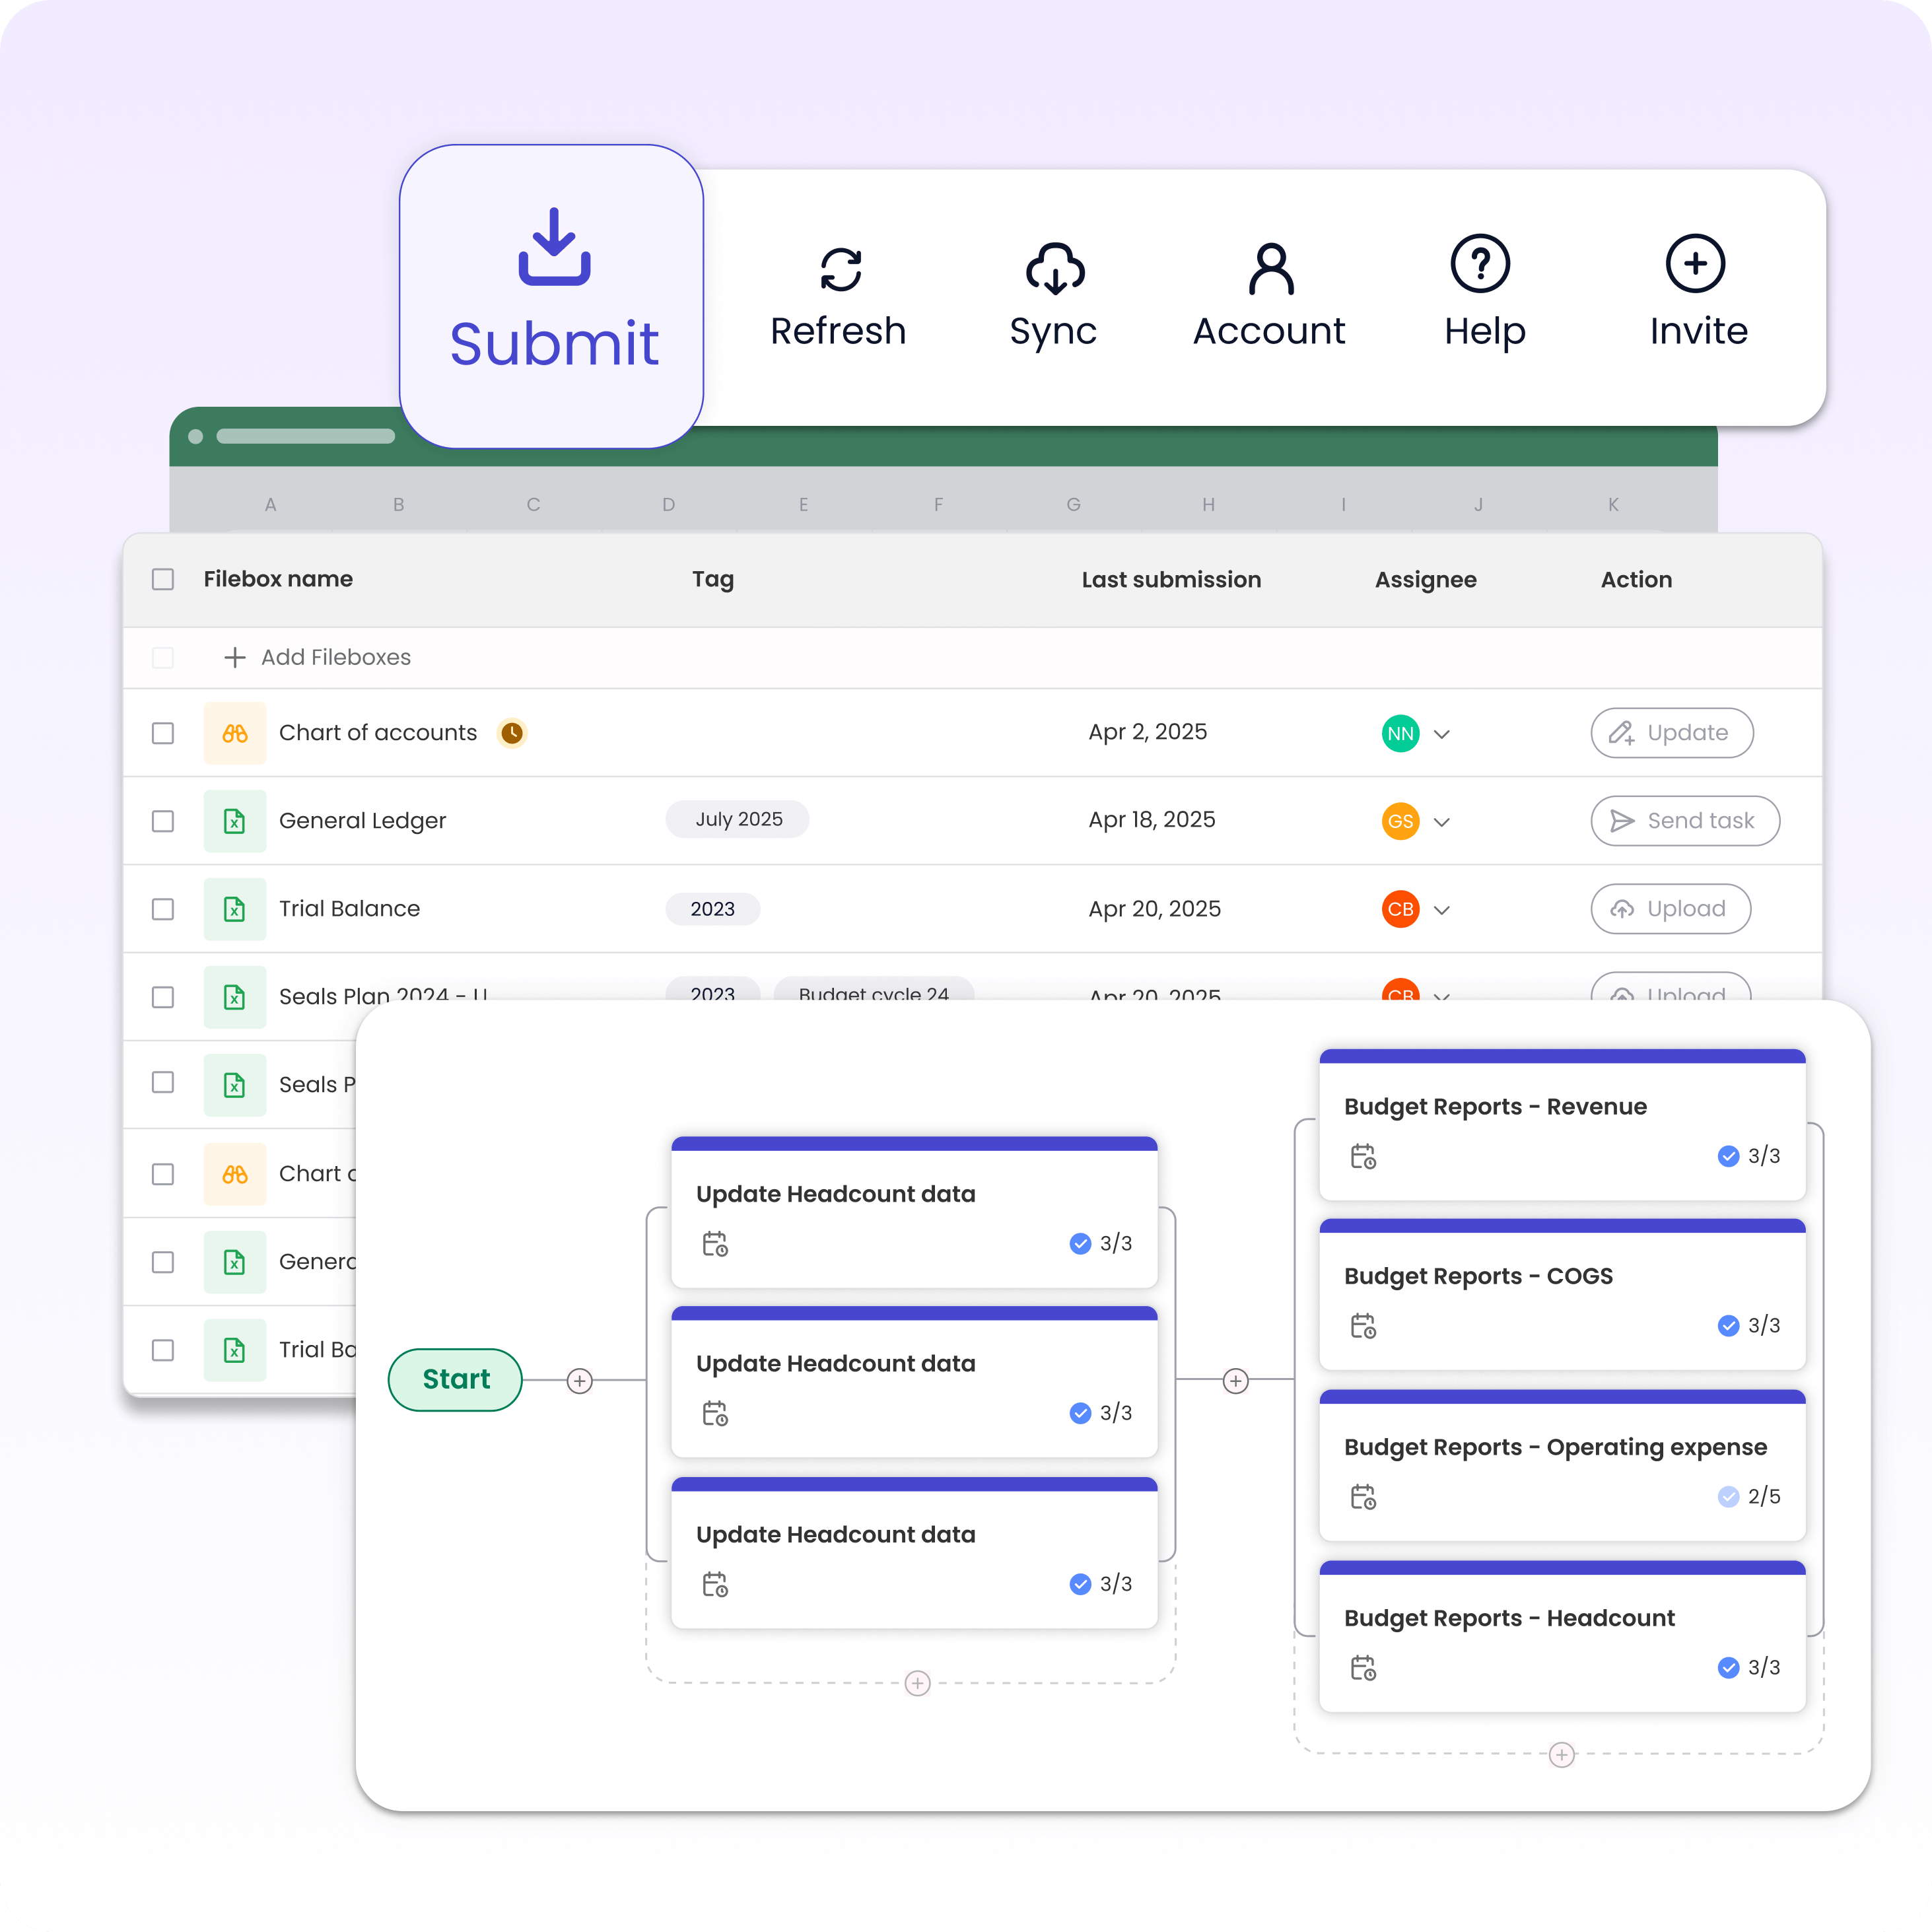
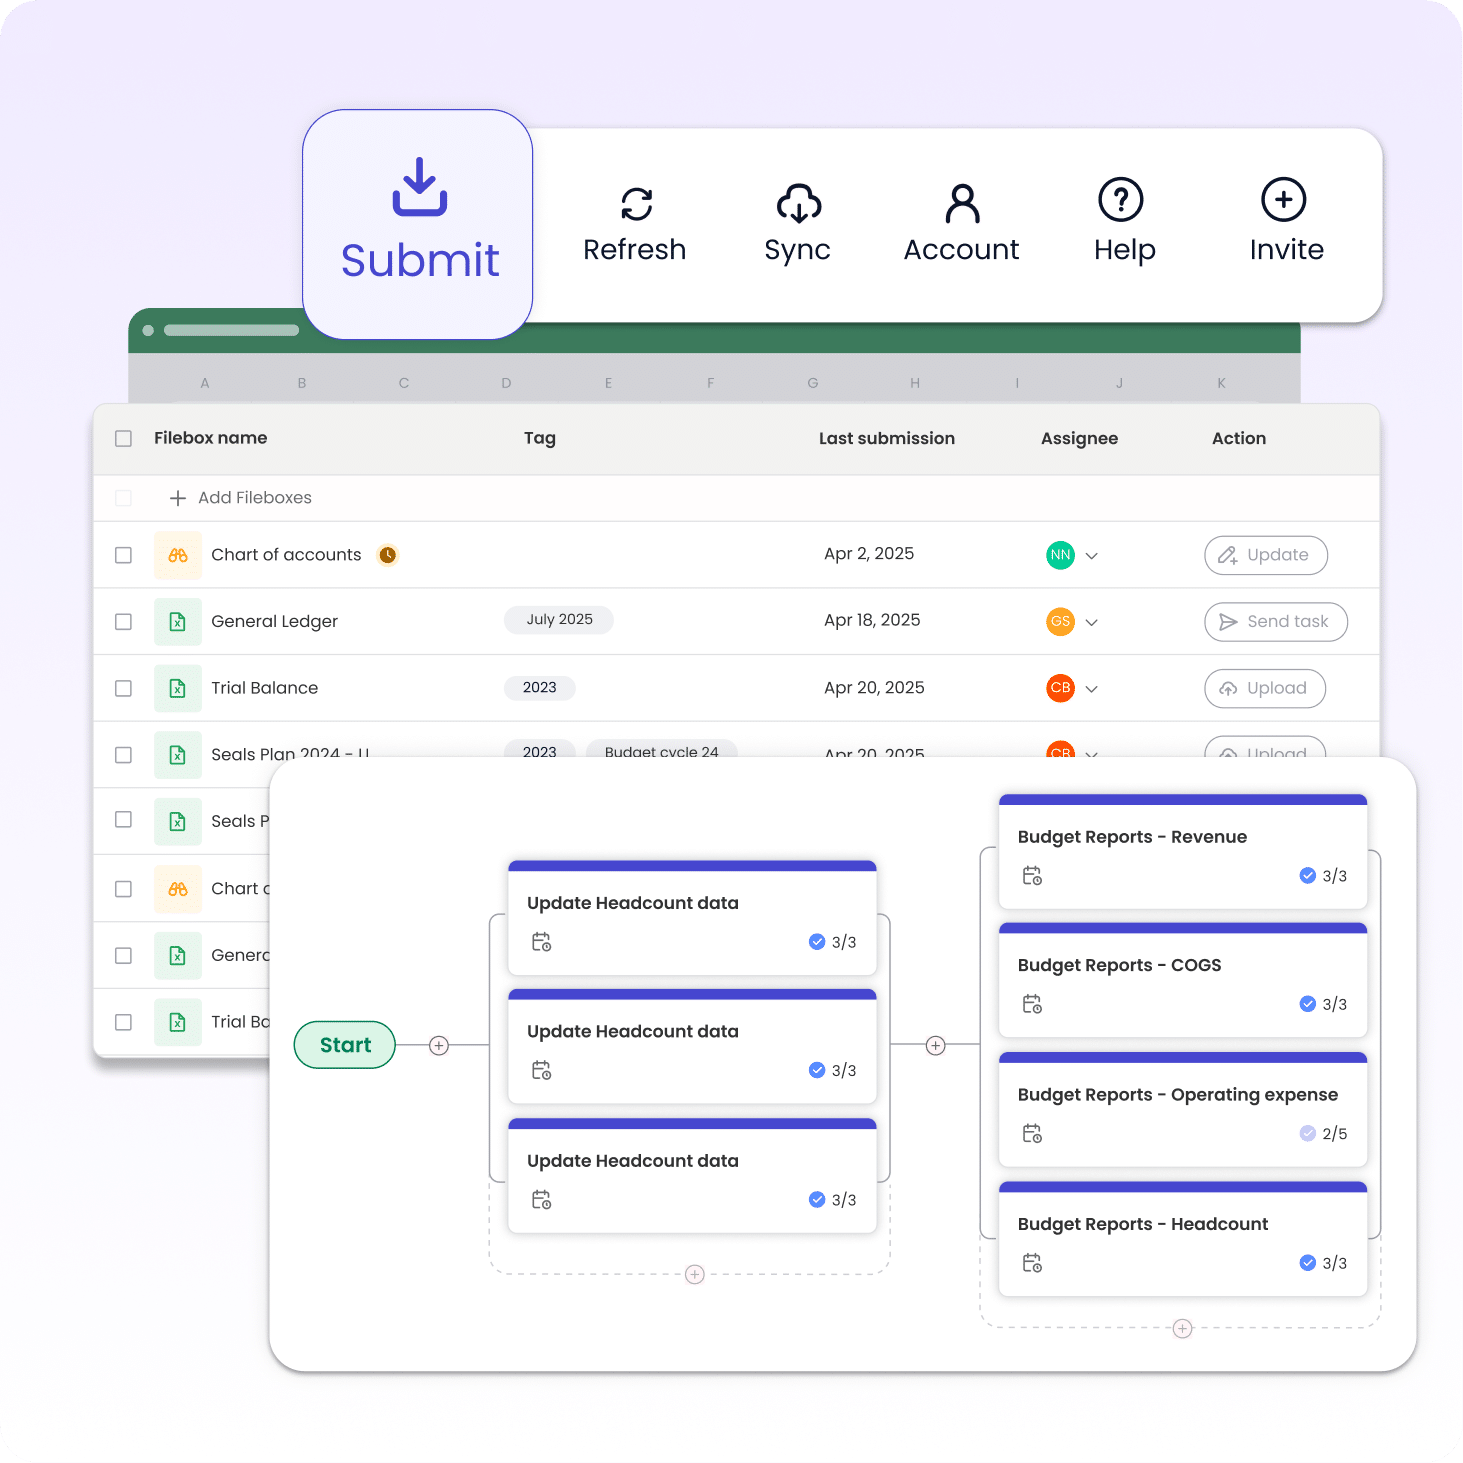
With Datarails, your dashboards bring numbers to life, making insights accessible to everyone. Build and customize dashboards, drill down into the layers behind your data, or instantly generate management-ready PowerPoint presentations.
Trusted by finance teams across many industries

“I use Datarails as my gut-check. I go through my four dashboards and immediately know where we stand. It gives me confidence in our data and clarity across all our entities.”
Unlock the “Why” behind the “What”
Datarails gives you the tools to uncover the “why” behind results and model “what if” scenarios, so finance leads the conversation.
- Identify key drivers and variances that impact growth. How big is the variance? What are the drivers? What should the company do in response?
- Leverage analysis tools to increase revenues and decrease costs.
- Optimize scenario analysis: adjust assumptions, model best- and worst-case outcomes, and stress test your plans.
“It has saved me so much time. The drill downs have facilitated a lot of analysis that we previously could not do or could only do in slow poke mode.”

Why choose Datarails for visualization?
Dashboards purpose-built for finance
Tell the story behind the numbers
Deep analysis without leaving Excel
Self-service insights for the entire organization
Discover more use cases
Learn why finance teams choose Datarails


FAQ
How is Datarails different from traditional BI tools?
Unlike generic BI platforms, Datarails is purpose-built for finance. You get customizable dashboards and analysis tools while staying in Excel. So you can drill down, model scenarios, and answer questions without leaving your workflows.
Can Datarails handle multiple entities, currencies, and file formats?
Do I need IT or technical expertise to build dashboards?
Can I keep working in Excel?
Yes. Datarails integrates directly with Excel, letting you build on your existing financial models, test assumptions, and run scenarios without having to start from scratch.
How does Datarails help with decision-making outside of finance?
Dashboards and reports can be shared across teams, giving leaders across the company access to the same source of truth. This empowers every department to make more informed, data-driven decisions.
How does Datarails save finance teams time?
By automating consolidation, reporting and planning, Datarails eliminates manual data prep and frees up hours each month. Time you can reinvest into analysis and strategic planning for the business.