What do FP&A professionals need to understand about data work and BI and the work that BI is doing?
Marcos Bento, Director BI, at Wasabi Technologies: “They need to translate business requests in English in a way that the BI folks can translate that into codes.
That’s where the magic happens.”
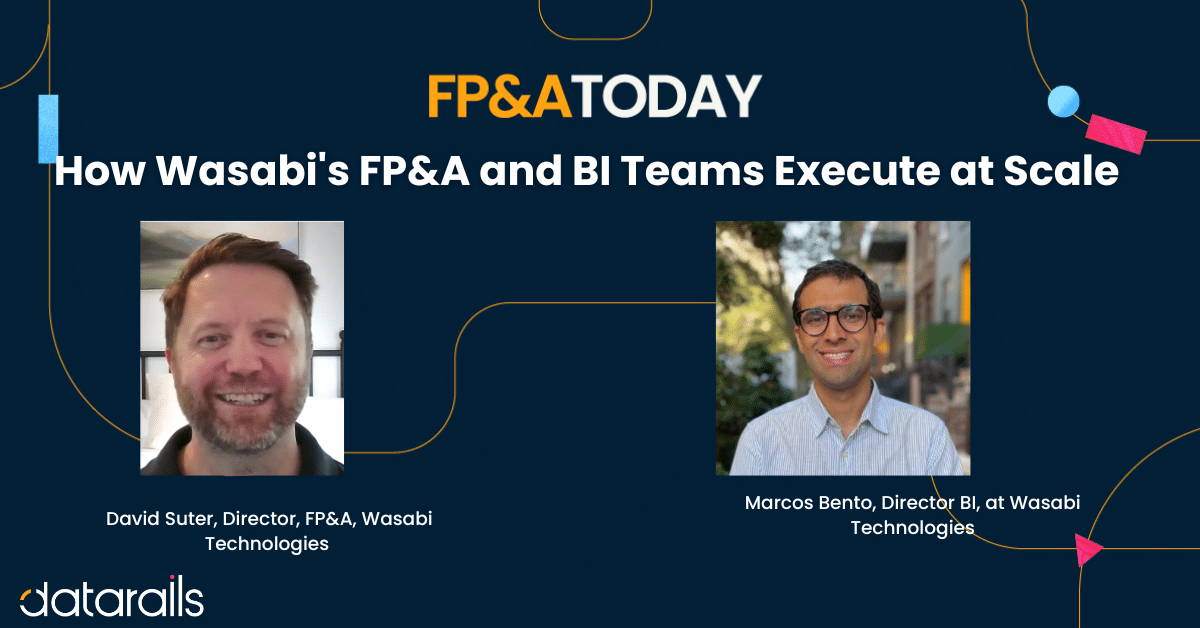
In part two of our deep dive with Marcos Bento (BI) and David Suter (FP&A) from Wasabi Technologies, we explore the execution side of their successful data partnership. In this episode:
- Our 130-Iteration Journey: Net retention metric evolution
- Cost per dollar of new ARR (and how settled on it)
- Storytelling across technical and executive audiences
- Lean team compositions (4-person FP&A, 5-person BI)
- Power of the problem solving skillset in our hiring
Full transcript
Glenn Hopper:
Today. Welcome back to part two of our Deep Dive with Marco Spinto and David Suiter from Wasabi Technologies. In part one, we explored how their fp, NA and BI teams work together to build trust, move fast, and create a high functioning data partnership. In this episode, we’ll shift gears into execution, how they define and govern metrics, manage data access, and use analytics to drive performance across wasabi’s multi-channel business. Let’s get back into it. Guys. Welcome back. Thanks. Thank you. I wanna lead off, actually, and talk about skills and mindset, and we, we talked about this a bit in talking about the partnership between you guys and episode one, but what makes someone successful in BI today? Marcos, starting with you, and then on the fp and a side, what do fp and a professionals need to understand about, uh, about data work? So, Marcos, we’ll start with you and then, and move over to Dave from there.
Marcos Bento:
Sure. Table stakes, you need to understand how to do some programming. In the case for wasabi, people are either writing SQL or Python code day in and day out. But more important than that, it’s the context and the outcome of this data. They should not be writing a thousand rows of s QL code just because they were asked to do an analysis. They need to understand to, they need to be able to translate code into actual English and to help everyone translate the data into actionable items. The work doesn’t stop when their dashboard is created, right? It is now that you have the dashboard, how can you help everyone to interpret and how can you help everyone on their teams to actually change their processes, close more deals, uh, make our customers even happier than they are today? That’s what truly sets someone apart from the bi crowds.
Glenn Hopper:
Actually, I’m gonna stay with you for a second, and then I’m, and then Dave, I’m gonna get, go with a two part question for you as well. From your perspective, we know fp and a people don’t all need to, uh, be able to write code now or to be machine learning engineers or, or whatever the case is. But from your perspective, what do fp and a professionals need to understand about data work and BI and the work that you guys are doing?
Marcos Bento:
They need to translate a business quests in English in a way that the business, that the BI folks can translate that into codes.
Glenn Hopper:
Love it. Yes.
Marcos Bento:
That’s where the magic happens. Last week, I think that Dave was in a call with the analyst and he was showing the sql, and they was, yeah, I may not understand this, but here’s what I need. And the, the analyst could translate, understand, move, whatever the English translation to code is, and that’s where it gets very exciting and interesting.
Glenn Hopper:
Love it. So I guess, Dave, I’ll flip it, uh, for you. Uh, what about the other way around, is there something that BI teams need to know about f fp and A that is maybe different than their other customers, or, I mean, to, honestly, to my mind, fp and a we’re, we’re like the OG BI people. We were doing BI before it had a name <laugh>. So that’s right. From your perspective, what do you think?
David Suter:
You know, I mean, I guess I would reiterate what, what Marco said. It’s, it’s the communication. It’s, it’s translating business requirements to technical input into a model. And then from their perspective, being able to explain it, Hey, we were looking at all this, we found these exceptions. You know, this is the order of magnitude, you know, probably immaterial or odd, you know, and, and being able to communicate and talk about those things we’ve found, uh, that’s just invaluable. That’s the most important skillset. Yeah.
Glenn Hopper:
You hit on something that I, and I want to ask both of you this, how important is storytelling to fp and a? Because we hear about it all the time now. It used to just be, I don’t know, you work in finance and you <laugh>, you do the, uh, flux analysis and you do some forecasting and all that, but now it’s business partnering, it’s storytelling and all the other parts of it. But when there’s more time, even if it’s an automation in Excel, when reports are getting built faster, the value is coming from those insights and that narrative. So on your team, David, are there certain people who are the better storytellers? Or is it, you’re getting, you’re getting the inputs from the team and you, you’re the one who’s crafting the story. How does storytelling work into fp and a at Wasabi?
David Suter:
Yeah, it’s a great point. It’s about, you know, how you communicate complex information to business owners of various levels of, of understanding. We deal with people who are highly technical, um, who wanna know every little detail. And then, you know, the very next hour we’re on with executives who want things at a very high level. So you, you have to story tell across very wide audience, you know, you, we talk about skill sets that peoples need. I think one of the things that we need, an fp and a is the ability to connect dots. Oh, I heard in this other call this thing, and how does that relate to what we’re trying to do in, you know, X, Y, and Z? Nobody’s ever drawing that line for you. You know, you’ve gotta hear something on a, on a company wide call that it might affect your business, or just the headlines, oh, there’s a new tariff regime coming that, okay, well, how’s that gonna affect our ability to purchase hardware and things like that. You’re always trying to connect the dots and make it more relatable and tell that story to folks. Great.
Glenn Hopper:
What about from a BI standpoint, Marcos?
Marcos Bento:
Everyone needs to be storytellers, Glen, to what we spoke earlier, and in the first episode, there is just so much data out there, and people may not be the best in understanding interpreting the data. So when showing a report with three, three different charts and 10 different numbers, it is, what does that mean? How can you use that number to influence and help each one of the teams and each one of the users of that information? You can be the best coder, but if you cannot say, Hey, what does this new report means? If you don’t, if you cannot tell an executive or someone in sales, what’s the purpose and the use of net retention, uh, and yet your work becomes a lot harder because now you cannot merge and you cannot be on their foot. You cannot be on the foot of your customers to understand, okay, now that I have net retention, what do I do with this measure if I don’t understand, it’s gonna be meaningless? And if this is such an important metric for our executive team, for the board, and for our investors, now, it’s, so, it’s part of our work to explain this for everyone.
Glenn Hopper:
I, uh, <laugh>, my regular listeners are gonna be rolling their eyes right now, but I, I, because I use this quote a lot, but I think around storytelling and adding that VA value, it is, and when you mention just how much data is out there and being able to sift through that and find the signal through the noise, but there’s a quote by Clifford Stole that I, I just use all the time, because it just, to me, it talks about the levels of value that we’re gonna bring as automation kind of creeps up. But it’s also just the, the function of, of both fp and a and bi. But the quote is, data is not information. Information is not knowledge, knowledge is not understanding and understanding is not wisdom. So I think about you’re getting the deluge of all, all the billboards and you, you’re identifying, okay, these are the ones you need to pay attention to.
And even beyond that, finding those trends, finding those key pieces of information, that that’s where we’re, we’re really starting to add the value. And I think that’s a shared concept for both fp and a and, and bi. So you mentioned net retention, and that is something that we talked about before the show. So I think, uh, it was something like working through 130 plus iterations of the net retention metric. Um, I, I would love to hear from both of you, but, uh, uh, who, who wants to start kind of telling us that story? What you learned about metric development, collaboration, data trust, how that must have been to go through so many iterations? And I know you’ll both comment, but who wants to, who wants to kick us off there?
Marcos Bento:
Let me hear from my customer first.
Glenn Hopper:
Oh,
David Suter:
<laugh>, it’s a messy thing. Lots of data and lots of change happening all the time. That retention can be a funny metric to pin down. I worked at a, at a prior company where we had a freemium model, and then customers would, you know, start to pay a little bit, but just such little immaterial dollars that if you looked at like customer retention, they would throw the numbers way off. And we ultimately, we came to the point of, well, let’s just call those like a paid trial and just exclude them entirely, uh, to get to our net retention numbers. There’s all these iterations of things like that to, to ultimately get to something that’s usable. And to the storytelling part, it’s like, okay, well, here’s why we’re gonna exclude this whole cohort of, of users. It’s just not relevant to what we’re trying to do as a business.
So yeah, it’s a, it’s a messy, messy thing with kind of a large influx data set like we have, but I think we finally got our arms around it in a way that is, you know, understandable, um, consistent, predictable in a way that like, makes sense, it feels right. Um, but, you know, it’s a, it’s a tough process. Um, a lot of times, you know, it feels like you’re, you know, one step back to take two steps forward, constantly iterating on draft after draft after draft. And I get frustrated. I’m sure the BI team gets frustrated, but, you know, we got there in the end. I think
Marcos Bento:
I’m very happy to hear about that, Glen <laugh>. So the journey to create this was very interesting. And if you want me, I can just go a little bit deeper. In the beginning, it was a manual, totally manual process from one analyst that had the software. It was on his laptop and his laptop only because it was a super expensive tool. And he was spending literally two full days working through the data, making sure that every filter is working properly and the data is clean enough that he can proper analyze and create and change all the foundations of what do we define as a customer to what they just said. What is our, what were our billing methods? What’s the revenue? What’s the a RR? What’s the storage of each one of our customers? It literally took him two full days to get this data through.
And to today’s point, we may not, back in four, four years ago, there were plenty of opportunities to make this more automated. And it to also, to what Dave said, it took us more than what he needed the data to be ready for. But when we moved the data from our on-prem and different sources into the data lake, which is, by the way, a shingles plug, you can actually use Wasabi as a storage provider for your Snowflake data. It’s cheaper. It says performant as any of the other icon scalers. Now that we have data into our WhatsApp bucket, we can slice and dice these in however we want. And it goes to Dave’s definition. We now have an agreed upon definition of what net retention is. Now. It, it automatically reports and translate the data every, every month. So from a two full day process, it’s now automated in, I don’t know, 15 minutes every 2:00 AM once a month.
David Suter:
Wow. And not, and not only that, it’s so much better. It’s so much more robust. We can dive into what’s behind the numbers and understand it. I mean, there’s like real, there’s real meat behind it. You know, we are light years from where we started a few years ago.
Glenn Hopper:
That’s incredible. So as you’re going through and defining this with all the data and all the parts out there, was it <laugh>? Did it feel like legislation or a, a courtroom battle or whatever where you’re trying to decide what to use and, and who has what inputs and how was the collaboration on just defining what goes into this metric, what’s excluded and how we build that and getting to something that everybody at your level and and up would understand and and agree on?
Marcos Bento:
Dave, do you wanna take
David Suter:
That? Yeah. I, I worked for a large public company and at one point was tasked with, find out how many new customers we got this quarter or this year, whatever. And I quickly found out that we couldn’t define new and we couldn’t define customer <laugh>.
Glenn Hopper:
So that sounds about right. Yeah.
David Suter:
Right. And so you, you know, it’s messy and it’s complicated. How do we eventually solve it? Well, you gotta cast a wide net, get all the people into the tent, and you gotta story tell to how, you know, what is this number, what are we trying to get out of it, and why do we wanna include that or exclude this? It’s just trying to build consensus around why this matters with a pretty broad set of stakeholders, making sure that everyone, every, we talk about net retention, this is what we mean. It’s a lot of repetition from your side. Marcos,
Marcos Bento:
I agree. I cannot add anything more than this. Yeah. <laugh>,
Glenn Hopper:
Fp and a today is brought to you by Data Rails. The world’s number one fp and a solution Data Rails is the artificial intelligence powered financial planning and analysis platform built for Excel users. That’s right. You can stay in Excel, but instead of facing hell for every budget month end close or forecast, you can enjoy a paradise of data consolidation, advanced visualization reporting and AI capabilities, plus game changing insights, giving you instant answers and your story created in seconds. Find out why more than a thousand finance teams use data Rails to uncover their company’s real story. Don’t replace Excel, embrace Excel, learn more@datarails.com.
So, <laugh>, another thing we talked about before the show was, uh, self-serve data marts. And I think, David, you said earlier, and, and this is where I always lived. I didn’t, I never had the good fortune having a team like Marcos and and his team, uh, to help me. So it was basically I was, I wanted all the data and I wanted to define it. And not, not that I’m gonna reinvent KPIs every quarter or whatever, but let me just pull it. I got burned a couple times with, um, as I sort of get hoovered up all the, the data in the company and owned it, coming up with this great idea of I didn’t have much of a team, and wouldn’t it be cool if everybody could get their own data? So we went down the road of a self-serve data mart until I got crushed in a board meeting by someone who’d done their own research <laugh> and pulled, uh, and, and pulled some different numbers to argue with the CFO in, in front of the board. Um, so I, and, and that ever since then, it seems like a great dream and I, I’d love to get there, but I cannot figure out to get there. So, Marcos, we’ll start with you <laugh> your thoughts on self-service data, kind of what its promise is, what are the pitfalls? What, what do you, what do you think, is that something you’ve deployed successfully that you’re doing on even a limited basis at Wasabi? What do you think?
Marcos Bento:
We have some level of success in this and some failures that we learned over time, Glen, we have like those 300 reports. Every person at Wasabi can log into our BI tool and have access to those reports, and we set up all the filters that a user can have on these data sets. So it’s not freely a data market. People can look at all the 400,000 columns that we have in our database. We give a couple of different types of reports with the exact view that we understand they will need. Again, if they need something different that it’s not across these reports, then we build report 301 or 401. But we always try to balance the ability of giving more versus less. Otherwise everyone can create from the same dataset, they can reach completely different results. And that’s not the objective of a data Mars.
David Suter:
Yeah, I think the challenge is people, they don’t, nobody, you don’t know what you don’t know, and the context and the nuance of why we report something the way we do is really important. So, um, yeah, I I completely agree with Marcos’s approach. You know, limited, um, controlled information in the hands of users is good. Unlimited information, hands of everybody. Yeah. Listen, listen. Downside to that. Yeah.
Glenn Hopper:
So there’s the reports that come out of bi, the reports that come out of fp and a and I’m sure different departments and divisions and and regions have their own reports, but how does ownership work for reporting of numbers there? Like who owns what when it comes to churn, cac, a RR, net, new logos, whatever’s being reported, is BI the ultimate reporting authority or does it go through finance? How does, how does that work? I mean,
David Suter:
Historically, I think a lot of that has been owned by fp and a, and I have reluctantly <laugh> given up some of that reporting to, uh, de Marcos and team. But I think a, a lot of the metrics you just rattled off there come Marcos’s team.
Glenn Hopper:
Gotcha. Is that because they’ve built automations and it’s just, it’s kind of part of those standard reports and it’s just set it and forget it, it’s defined, it’s out there, it’s consistent and it’s automated.
Marcos Bento:
Partly yes. Partly yes. Glenn. And part of how we came up with the, every Monday morning, we have the set of reports that we need to submit to the exec team. That was five years ago from the PI team. That was just a process of continuous iterations of this. But Glenn, what’s important about this is we are not on an island, right? It’s not the Iver tower. It’s not that, oh, we are reporting on net retention that Dave doesn’t influence or doesn’t have a view on this. We can only be successful if we work together. If I’m working by my own. It goes back to what we spoke. It can never be successful if it’s working by your own.
Glenn Hopper:
Makes sense. Still, you have a, uh, an embarrassment of riches when it comes to data, and I think about just how complex the data, but also your go to market direct channel B2B, B2C. How do you make sure that metrics reflect that complexity without, I mean, it just, it gets so deep, so fast. So it seems like there would be a potential to overwhelm people with that. And this goes to the storytelling, even if it’s just visualization of the storytelling of just so much information. Like how do, how do you approach that? And maybe start, maybe start on the bi side and then, uh, Dave on the fp and a side, you know, it’s, it’s not as much data underneath, but there’s still all the channels and all the reporting and the different ways that people wanna slice and dive it.
Marcos Bento:
So at the most fundamental way to think about our business plan, we sell cloud storage. We sell through a couple different billing methods and a couple different go-to market strategies. So this becomes a four by four matrix. So you, you have those two billing methods and those two go-to market strategies if you wanna drill this down per region. And then for each region we have sub regions, then you can also get these per sales rep. So you can see these four rows becoming 50 rows very soon very fast. So it depends on the audience and the objective of the report. If it is for the executive team, we will go for only the most foundational data sources. If we need to analyze commissions, then we group by or we analyze on all the individual roles that we need for reporting purposes.
David Suter:
Yeah. You know, you mentioned like direct channel, b2, BBC, you know, it’s said, you know, different pricing schemes. We have something like six orders of magnitude between smallest and largest customers. So we have a really long tail. I mean, it’s a lot. In the past, I think we have gotten in trouble trying to boil the ocean, trying to handle all these edge cases and exemptions and this and that and, and just, you know, again, try to boil the ocean and ended up making no progress. So back to my earlier point of trying to, you know, avoid that metrics bloat, what are the high level simple three to five metrics we can track? What we ended up doing was really, I think, taking things up to a much higher level. Now, it doesn’t account for the nuance and the timing and the this or the that, but you know, we can come up with metrics that are digestible, easy to understand, directionally correct, and actionable. That’s better than trying to come up with something down to the, that down to the penny that, uh, nobody can understand.
Glenn Hopper:
Yeah. And I, the crazy thing with that, and I just, it, it just keeps feel like, uh, peeling back layers of an onion or if you give a pig a pancake, that kind of thing. <laugh>. But, so not every metric needs to be revolutionary, but they need to be understood. So you give this high level, but then it just always starts, starts begging the question all the way down. So how do you ensure, okay, we’ve rolled it up, here’s your top level, but you also need to understand how that’s built without getting into the complexity of the 130 iterations to, to build a number. But so how do you ensure that the stakeholders really understand the story behind that, that number?
David Suter:
I, I think it’s a little bit of what we talked about before. It’s, it’s storytelling, it’s communication, it’s reiterating, repetition is good. Tell ’em what you’re gonna tell ’em, tell ’em, and then tell ’em what you told them. That kind of thing. Yep,
Glenn Hopper:
Yep.
David Suter:
You know, and, and, and yeah, it is, it is knowing your audience. It is making it digestible and understandable. You know, you come to an executive meeting with some, it, it’s like, you know, by the time you have to explain the joke, uh, you’ve lost Right. <laugh>. Right, right. If you’re a, you know, trying to explain a metric to an executive team, uh, you, you, you’re, you’ve lost <laugh>.
Glenn Hopper:
Yep, yep. Great. Great point there. A hundred percent. And I guess with that, when you guys changed from the two day process on someone’s computer, you did have to change the calculation and the rules around that metric. How difficult is that? Because I’m, I feel like probably there was a shift in reporting one quarter to the next when you changed to the new metric. Is that, I mean, that’s just kind of part of it, and you’re saying, Hey, we’re getting a better number for you quicker and all that. But is that, how, how complicated is it when you do come in, especially if you come in, I think Dave, you, you’ve came in and stood up fp and a there, right? So you’re probably have had to work on a lot of, uh, metrics that maybe change the definition and, and go through the data dictionary and, and work through that. Was that difficult? Because I know you guys aren’t public, but you are, you have the pressure of investors and management anytime the way that reporting goes changes, that’s an issue.
David Suter:
Sure. Yeah. I, I, uh, to be clear, I didn’t stand up fp a that was, that was established here before me. Um, gotcha. But, uh, yeah, I definitely inherited some things that weren’t great. Yeah. You know, we have the benefit of not being public, and so we can go back and restate metrics. Yeah. A change in definition is you can’t just, you can’t just have a stair step change without explaining it. So yeah, you go back and restate prior periods it was, you know, it was a, now it’s B and this is what that trend looks like over time. Yeah. And try to make it simple and digestible and equity gets it. Yeah.
Marcos Bento:
And Glen, it was also part of a lot of communication. Uh, it was setting expectations that, hey, change is coming to net retention. It may change how the numbers will come. And we, we will be able to explain why those changes are happening. And because we were private, we had all the buy-in from the executive team, I think it was important how the transition went.
Glenn Hopper:
Yeah, that makes complete sense. One metric in particular, we talked about, uh, before the show was, uh, cost per dollar of new a RR. Tell me about how you landed on that and what that helps you uncover or, or change.
David Suter:
Yeah, always looking for ROI metrics. Um, it can be a challenge, you know, particularly with like r and d for example, how do you measure the return on RD? Um, but for sales and marketing, it was really because of that complex go-to-market approach. Some, you know, some sales are direct, some are through a channel. How are we allocating those dollars across those two different channels? Uh, it can be messy and, you know, again, you got a little caught up trying to boil the ocean on some of these things. But ultimately, you know, came up with, yeah, cost per dollar of net new a RR, it’s really simple. It’s literally sales and marketing expense divided by incremental a RR and it handle, you know, it, it, it can be accrued measure and maybe a little, you know, at times imperfect because marketing dollars you spend today might pay off, you know, one or two quarters in the future.
So it’s not a one-to-one. But again, it is directionally correct. If you track it over time, it will hold true. It is also something that you can get a proxy for how your competitors are doing, looking at public publicly available information. Um, it’s not perfect, but you can look at someone’s Q4 revenue times four, that’s a proxy for their a RR. You can look at their sales and marketing and look at how you compare against the competition. So yeah, it was a great way to validate whether we are, you know, this is, again, coming looking for a third data point. It was an ability, it was, it was a way for us to be able to look at ourselves and our competitors in a even playing field to say, this is how we stack up. And it was a, you know, it was a, it was great. We created this little bubble chart, you know, the size of the bubble was the, the amount of revenue of the customer. And we plotted revenue growth against cost of net new a RR. And it’s a great view, it’s a great comparison of how you’re performing, how your competitors are performing and looks at your turn on sales and marketing dollars.
Glenn Hopper:
That is great. When you can find something like that, that you can actually roughly benchmark, it’s so much more helpful too. So that’s, I love that. Yeah. All right. Well, I feel like we’re, we’re getting close already to running out of time again. I got a bunch more questions. So I’m gonna <laugh>, I’m gonna pick and choose to be sure we land this thing without, without going over. Let’s talk about how your teams are structured. So let’s start, Dave, with you, uh, on, on your full team and, uh, maybe walk us through size and what the roles and and skillset sets are for your team members.
David Suter:
Sure. Right now we’re four of us, including myself. So we are a lean and mean. For years we were, there was just three of us, and it was myself and two analysts under me. Uh, they were business partners to the rest of the organization. Uh, one focused on a lot of the technical teams, the a center operations, customer support, uh, the other on sales and marketing and GNA. We recently added another person to help support one of those guys so that we can get him up a little bit in his thinking, uh, in his work. So it’s myself, three guys under me. I like being a little bit on the lean side. Uh, you know, you stay busy, you get your hands into lots of different projects. You gotta always balance the, the demand on your time versus the resources you got. But it’s a great group. Works well together, easy to work with, really fun to, uh, fun team to work with.
Glenn Hopper:
Yeah. And are they all, um, were you hiring pretty much the same skillset for each, or do you have one, one role that maybe needs to be a little better at visualization or at, or whatever? What’s the breakdown kind of in the difference in, in capabilities?
David Suter:
Mostly the same, I think, but yeah, you know, if we could hire a guy with some sales and marketing experience to handle that sort of business partnership, that’s even better. Um, you know, because that is very different than the highly technical, detailed oriented, uh, technical folks. Um, but broadly speaking, you know, you’re looking for problem solvers. You know, obviously the table stakes of, you know, you know, some accounting, you can do some Excel modeling. But, you know, really looking for that problem solving skillset, that pragmatic approach to, to issues somebody who can communicate. I always kind of joke, you gotta be a little bit of a chameleon because you’re talking to all different people across all these functions. And you know, from an entry-level person to an executive, you gotta be able to, you gotta be able to talk to people in the way that they wanna talk to you with. So you gotta be a little bit of a chameleon there. But I think the, you know, the, the people that I’m trying to hire, I think are pretty interchangeable in, in that we can, you know, you wear a lot of hats, you can, can do a lot of different roles. Um, the core problem solving skillset is what I’m probably most looking for.
Glenn Hopper:
Yeah. It sounds like, um, that you’re weighted and I think it, it’s always tough to try to figure out that, that balance, but it’s, I I’m trying to remember a, a business case study from a million years ago, but I think it was Southwest, they’re hiring, they would hire personalities more than skill sets because they could train, you know, if you got the right person, you could train them for whatever. But, uh, like you said, Excel and uh, being able to model and all that, that’s, that’s table stakes. But would you say you weight those soft skills pretty high when you’re interviewing and selecting?
David Suter:
Yeah, definitely. You, you can teach anybody an Excel formula, right? Um, you can’t teach them how to communicate or be easy to work with or to story tell, things like that. Yeah. Those are the soft skills that are, you, you can’t teach that.
Glenn Hopper:
Well, and it’s probably that, going back to the very first bit that we talked about is the relationships between you guys and, and being able to work across departments for, for both of you across the company that probably really paid off there and having the, ’cause there’s, there’s a lot of people who are great engineers or great at Excel, but man, they’re not someone you wanna talk to. <laugh>, just stick ’em in the back corner. <laugh>.
David Suter:
That’s right. And with a small team, we don’t have the luxury of having those guys.
Glenn Hopper:
Yeah. How about Marcos on the, on the BI side?
Marcos Bento:
So we are five, so one data scientist, one data analyst, one data engineer, and then one intern YO each one has their primary hat. They’re always using everyone’s head. So you may be working in a project, doing the pipelines, creating the pipelines to ingest new data. We just ingested, uh, our ERP data into the data lake, uh, earlier this year. Now this, that same person. Now it’s a test to create the reports for that dataset. It’s not the person has to have end-to-end skills, understand, be flexible, have also have the humility of understanding that sometimes you don’t know everything, but you have a core group of team and a great organization that can teach you and guide you to whatever problems you have. Our hiring process, we try to get a mix of soft skills and hard skills. We give takeaway exercises. We wanna understand if people know how to with this dataset, please calculate and give the insights on net retention.
If you don’t know net retention, I expect you to at least go to your search engine and then look at this and say, okay, what the heck is net retention rates? How would a software as a services company analyze this? What me as a data analyst or as a data person, can use this data to provide the insights? And we will use that take home exercise for some follow up interviews. So now we have data, obviously mass data, anonymized data, not wasabi related, but at least we know and we can understand how the day-to-day will be.
Glenn Hopper:
I think I was getting to this earlier about domain expertise and obviously in in finance it’s become a much bigger deal. But to Dave’s point, you can, you can train people and or to, to your point about Google it, figure it out when you’re hiring. I, I feel like in data science and, and data engineering in bi, there’s the, the supply and demand. There’s such high demand right now. You probably can’t pull out exactly, you can’t write the job description and then just reach into the ether and pull that exact person. But how much are you waiting, coming from SaaS or coming straight from school industry experience and, and the type of work? Or is it more they just need to really get data and have the right approach to it?
Marcos Bento:
Great question, Glen. So it’s interesting, when we were looking at our data analyst position, we send the exact same data set for the people interviewing, and there was not two responses that were equal. So with the same data set, with the same question, Hey, please provide me answer on churn and net retention. Every single person got different questions and answers. So I wanna understand during the take home exercise, does this person ask me any emails, ask me for clarifying questions, I wanna understand if they are asking me or if they are gonna send, we give a week for the person to work. I wanna see if the person sends me a clarifying question the night before the deadline. Or if they are asking two days after they got the data. These are some of the very small tips that you get to understand who, how the person works, and is this a person that I wanna work with?
Glenn Hopper:
You’ve come full circle in, in seen the, the way you guys work together, the type of work that you’re doing for companies that are trying to replicate what you guys have built, where, where should they start? And I don’t know if we start, you know, at at the base data level or startup upstream with, with fp and a or, uh, or downstream rather with fp and a. But is it to, to, to be able to have this kind of insight? Is it, do you start with tooling process org design or something something else? Like if, if you’re trying to have the BI and fp and a team work together, so well, is there anything that you can think of that’s sort of the secret sauce? And I know we talked about people and maybe it, it comes down to that, but there is also the whole process and, and everything else around it. So I don’t know, I, and I maybe, I don’t know if you both have a answer to that, but I’ll throw it out and see who’s got some ideas around that.
David Suter:
Yeah, I, I’ll, I’ll take a stab at it. <laugh>, you know, I think it’s the classic people process and technology at the right people in the right role. Give ’em the right tools and then, you know, make ’em, you know, make sure they’re executing against the right process. And of course, the hardest part of all that is recognizing when one of those things is not right and making a change. But where to start, I would say it’s get the right people in the right roles. Problem solvers, problem pragmatic approach to to, to solutions communicators. Uh, you get the right people in there. And like I said, you know, you, you can teach ’em excel, you can teach ’em bi, um, but you get those, the people who approach the problems the right way. That that’s, that’s worth more than, than somebody who knows how to write a Python code. Yeah, yeah. <laugh>.
Glenn Hopper:
So how about from your side, Marcos?
Marcos Bento:
I would add that we also have a leadership team that allow us to learn and to improve our processes. We know what they are expecting from us. We hope that we blow their expectations every day. Sometimes we don’t. But we are also willing to learn, adjust, and improve throughout the, the process. Some of these changes will take time, then it becomes a matter of let’s discuss, let’s set expectations. Let’s understand how we can deliver what’s being asked from us. And from that we can improve. We have room for adjustments in innovation and our CFO and the entire, uh, executive team is always looking for what’s next and how else can we make or provide better data and provide to allow for better, better decisions.
Glenn Hopper:
And having leadership understand as you’re, you know, building the airplane while it’s flying, um, and being and having that patience and letting you guys, uh, work through this together. I could see how the cross departmental development for your employees goes up too. But I’m wondering, and this is always tough with as busy as you guys are, as lean as your teams are, how do you handle training of your employees? Is it, um, kind of just everybody’s learning on the, on the go, or do you structure in any, uh, any organized coaching or, or mentoring pro programs? How do you develop your teams? It’s a little bit of all, all the above.
David Suter:
There’s always a big benefit of hands-on learning, but you’ve gotta have coaching along the way. I definitely try to do that with my directs. And then, uh, when we have like new, new somebody, new start, what I also like is kind of the buddy system. Um, ’cause they’re gonna be willing to tell a peer, they’re gonna be more frank, I think with a peer than there would be with a manager, right? Yeah. That relationship is just inherently different. So it’s a lot of coaching, um, learning, you know, in the real world. Um, and I always say it kind of, it starts real slow and then all of a sudden it gets real fast because the training wheels kind of come off and you gotta get something done. So it’s a little bit of all the above. A lot of training, a lot of like, hands-on doing actual work. And I think that buddy system is invaluable.
Glenn Hopper:
What about collaborative training between your two departments, or maybe that’s more happens just in the, in the nature of working together, but have you guys considered or done any training where here’s where FBNA can learn more about BI or here’s where BI can learn more about corporate finance or,
Marcos Bento:
That’s actually a great question and probably a great suggestion for us to implement. Glen. I, I’m sure that I can learn a lot from Dave and his team about knowing what they know about finance and what else can we do to provide, to help them. We use Slack is probably what everyone communicates for fast and quick chats. We have a lot of Zoom calls where we are talking, discussing. But again, it’s always driven by action. It is, okay, what are the next steps? How else when’s our next follow up? When can we provide something for Dave and his team to see the data and the next data in the next, if it’s not collaborative, it iterative and fast, it’s not working well enough.
Glenn Hopper:
Alright, we’re right at time. I’m gonna go lightning round here. One more question we ask everybody. I gotta ask both of you, what is your favorite Excel function? And y Dave, we’ll start with you
David Suter:
X lookup
Glenn Hopper:
Love it.
David Suter:
It, you know, it is, it is more versatile than, uh, uh, v lookup.
Glenn Hopper:
Yeah,
David Suter:
Bitcoin as powerful as index match, but it’s, but it’s, but it’s got, you know, the built-in if error check and uh, it’s the best
Glenn Hopper:
Cool Marcos,
Marcos Bento:
I am a if person.
Glenn Hopper:
Yep.
Marcos Bento:
I would love to build those 300 if statements. It goes wild, wild to get to catch every scenario. But I learned from Dave about X lookup. I was a VLOOKUP person Ev ever since I got this slack from him, I never looked back at vlookup
Glenn Hopper:
<laugh>. Love it. Love it. So guys, thank you so much. I really, I think this is gonna be a great two part episode. I really appreciate your time and insights, so thank you both for coming on.
Marcos Bento:
Likewise. Thank you very much.