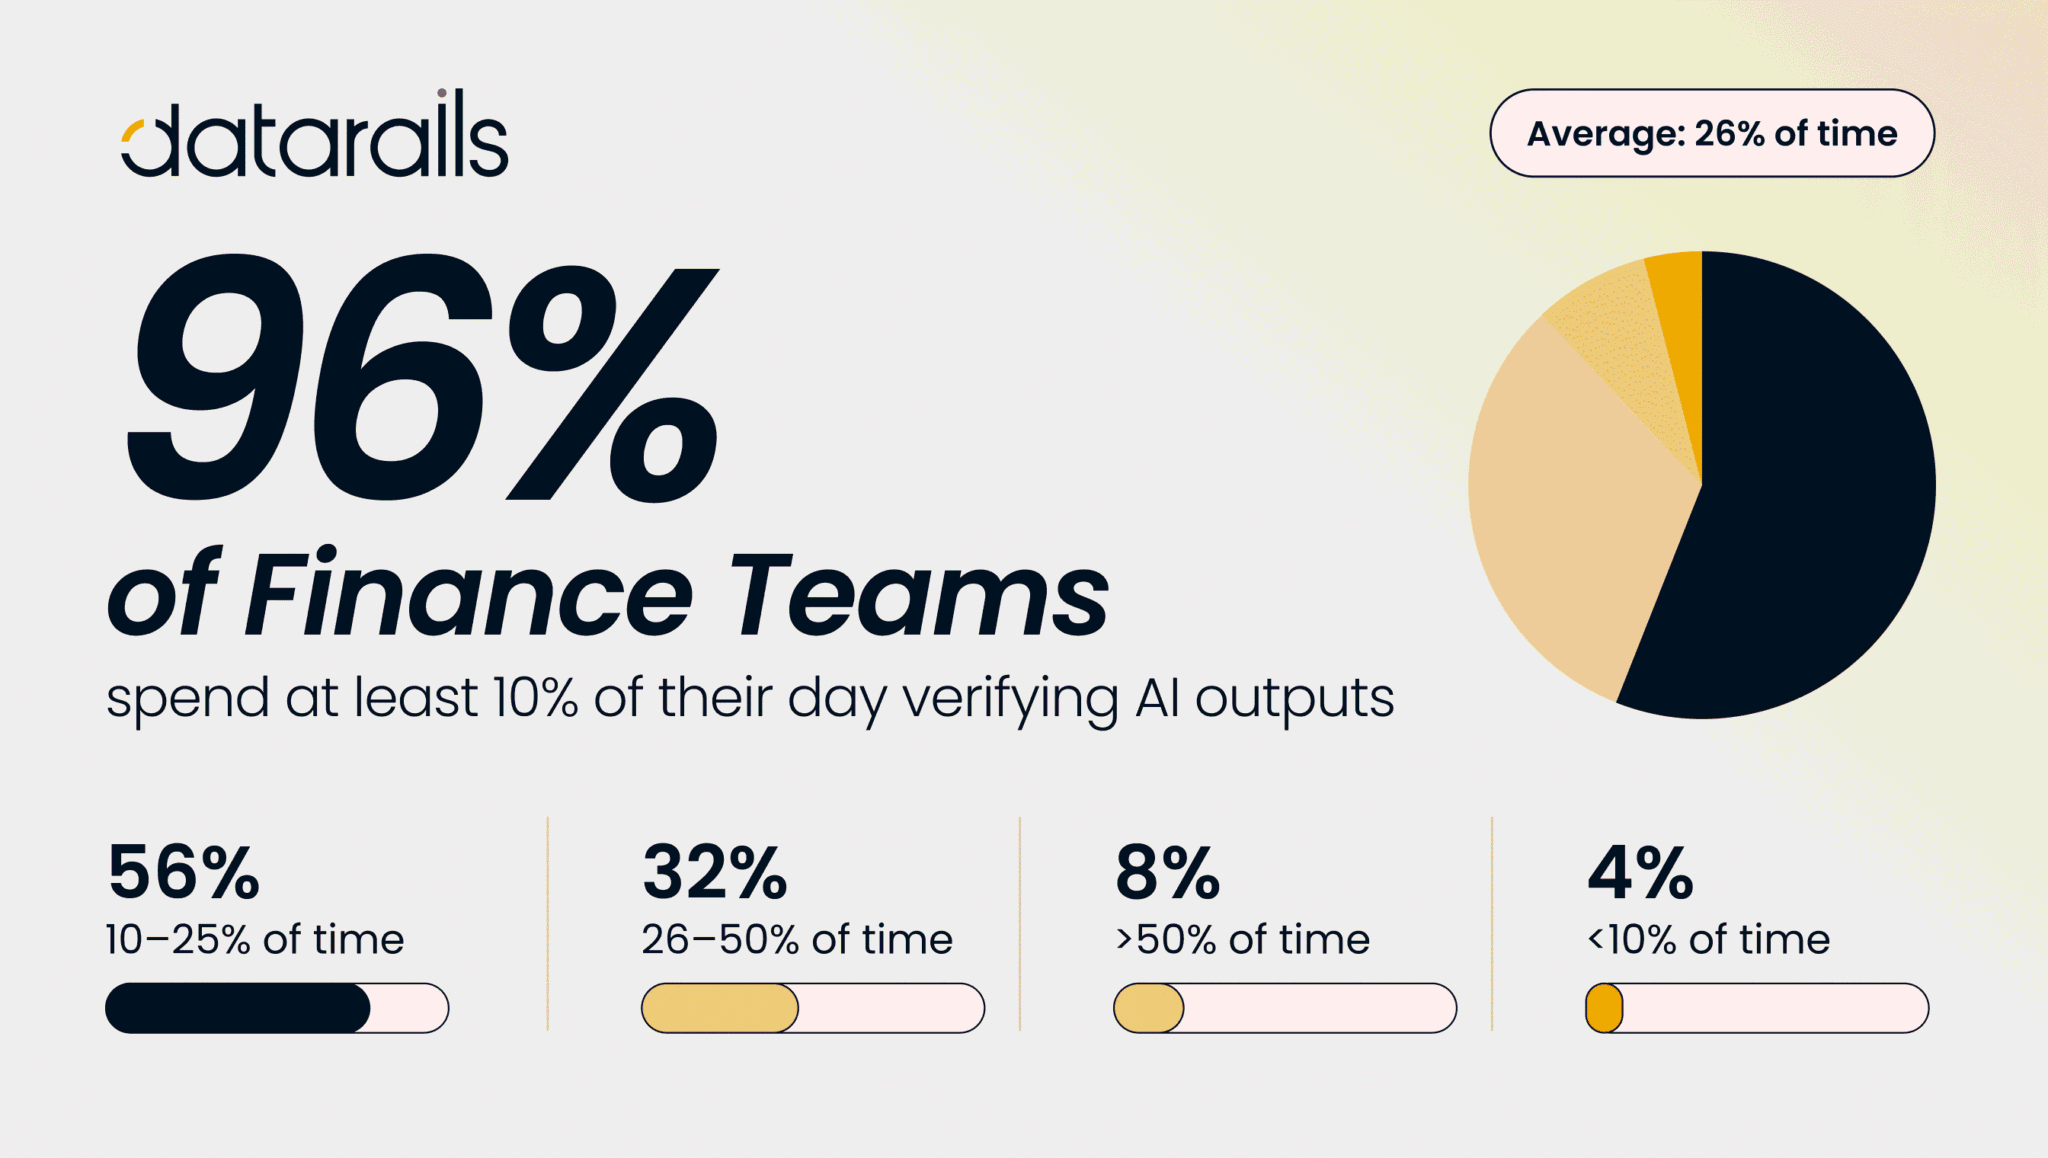
Click for Takeaways: ROI of AI in FInance
- Most AI pilots never reach the P&L: Research across more than 300 enterprise AI deployments found that 95% delivered no measurable P&L impact, and only about 5% of enterprise-grade systems reached production.
- Budget cycles have stalled at 8.7 weeks: The average time to produce a budget is unchanged from three years ago, even as organizations poured money into planning technology.
- Finance teams name data as the barrier: 61% of FP&A professionals point to unreliable data and 60% to inaccessible data as the main obstacle to technology success, both ranking above skills and tools.
- Partnering outperforms building alone: Buying from specialized vendors succeeds about 67% of the time, while internal-only AI builds succeed about 33% of the time .
- Back-office automation carries the strongest returns: Modeling puts accounts payable automation at 111% ROI with payback in under six months, yet more than half of generative AI budgets still go to sales and marketing.
Most finance leaders are being asked to justify AI spending they cannot yet measure.
But there are two key questions driving this pressure:
- What should a finance AI investment return?
- Why has the pilot already funded produced nothing worth reporting?
Both have documented answers now, published by MIT, the Association for Financial Professionals, and Forrester.
The first answer comes in weeks and percentage points. The second comes down to what happened to the data before anyone switched the model on.
What ROI of AI in Finance Should You Expect?
The ROI of AI in finance concentrates in four measurable places: budget cycle time, month-end close duration, accounts payable processing cost, and cash forecast accuracy. Returns in those four areas are documented and repeatable. Returns claimed outside them are mostly asserted.
The catch is how few organizations get there. Most AI pilots never produce a return in any of those areas, and the reason is consistent enough to plan around.
The largest single variable is whether financial data was consolidated and governed before the AI layer went on top of it. For a wider view of where the technology fits across the function, use this AI in FP&A guide to explore popular use cases in depth.
What Is the Expected ROI from Automating Budgeting?
The return on automating budgeting lands first in cycle time, then in forecast accuracy and recovered analyst hours.
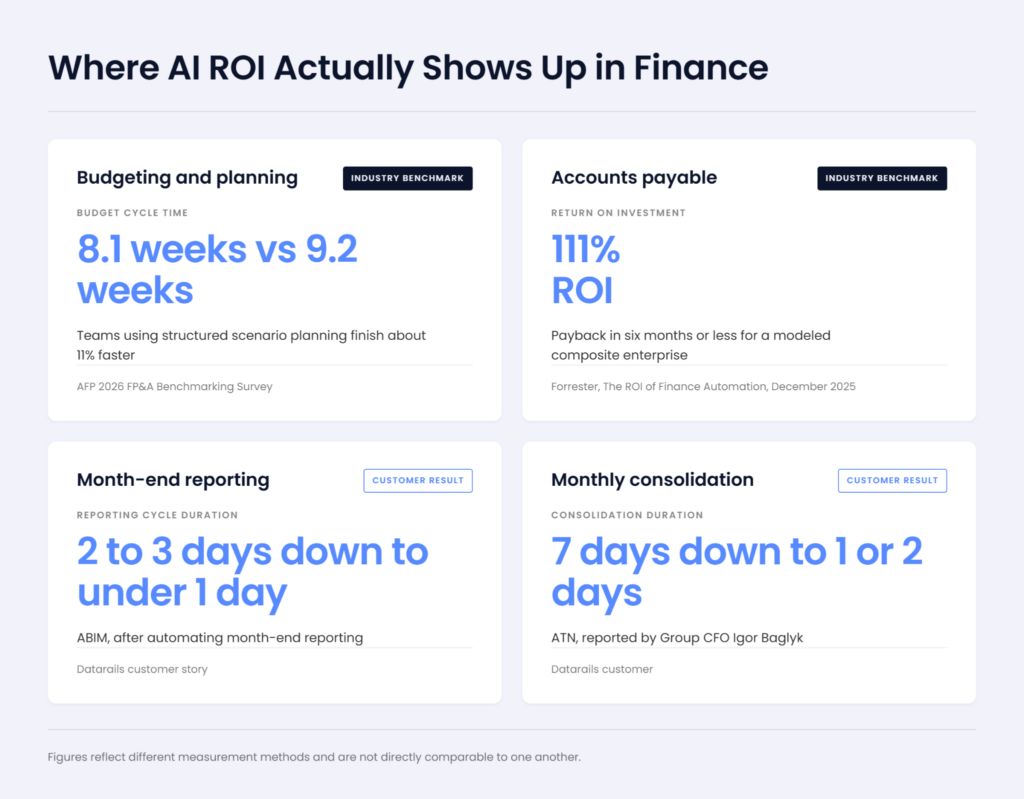
The realistic benchmark is narrower than most vendor claims suggest. The 2026 AFP FP&A Benchmarking Survey, based on 332 finance practitioners across 54 countries, found that the average budget cycle runs 8.7 weeks, unchanged from three years earlier despite widespread adoption of planning technology. The teams that got faster changed their process alongside the tool. Organizations using structured scenario planning complete budgets in an average of 8.1 weeks, about 11% faster than the 9.2 weeks reported by teams that skip the method.
That gap sets the honest expectation. The ROI from automating budgeting on top of consolidated, governed data typically arrives as days to weeks of recovered cycle time per planning round, along with a sharp reduction in the manual reconciliation that consumes the front half of every cycle.
Datarails customers report larger swings once consolidation is automated first. At ABIM, month-end reporting fell from roughly two to three business days to under a day. At ATN, Group CFO Igor Baglyk reported monthly consolidation dropping from seven days to one or two.
In any case, cycle time is the metric that survives scrutiny because it’s measurable before and after, hard to inflate, and tied to a cost the business already understands: how long the organization waits for a plan it can act on. Accuracy improvements matter, too, though they take several cycles to prove while hours saved are easy to overstate.
The AFP data also explains why so many budgeting automation projects underdeliver. Only 38% of organizations use structured scenario planning at all. Running the same sequential, spreadsheet-collection process through a new platform produces a faster version of the same bottleneck. The gains come from consolidating the inputs, standardizing assumptions across budget owners, and handing every owner one agreed set of numbers before the cycle starts. Teams that pair automated budgeting and forecasting with a consolidated data layer see compounding effects, such as shorter collection times, and the freed capacity moves into scenario work.
Where the ROI of AI in Finance Shows Up
Budgeting is the most visible of the four areas. The other three sit further back in the workflow, in the reconciliation and processing work that happens before anyone opens a model, and that is where the credible AI in finance statistics cluster.
Month-end close and reconciliation
The close produces returns fastest because the work is repetitive, rule-bound, and already measured in days.
Matching, tie-outs, intercompany eliminations, and variance commentary all follow patterns a model can learn once the underlying data is mapped. Teams running an automated month-end close on consolidated data typically cut whole days from the reporting portion of the cycle, which is the part finance controls directly.
Accounts payable processing
Forrester modeled a composite global enterprise in its research on the ROI of finance automation and found accounts payable automation returning 111% with payback in under six months.
Forrester presents that figure as a planning framework, and finance leaders should carry it into a board conversation the same way. The drivers are invoice matching, exception handling, and captured early-payment discounts.
Cash forecasting and analysis
Cash forecasting returns are harder to express as a percentage and more valuable when they land.
Accuracy gains here change borrowing decisions and working capital positions instead of headcount. The same applies to anomaly detection and narrative generation across reporting, where the value shows up as earlier decisions. Datarails covers those specific workflows in its overview of AI for financial analysis.
Why Do AI Pilots in Finance Fail?
Finance AI pilots stall at roughly the same rate as enterprise AI pilots generally, and the reasons are documented.
MIT’s NANDA initiative published The GenAI Divide: State of AI in Business 2025 in July 2025, reviewing more than 300 public AI deployments alongside leadership interviews and employee surveys. It found that 95% of enterprise generative AI pilots produced no measurable P&L impact. Among organizations that evaluated enterprise-grade systems, 60% reached evaluation, 20% reached a pilot, and 5% went live.
The AI pilot failure rate has three documented drivers in that research:
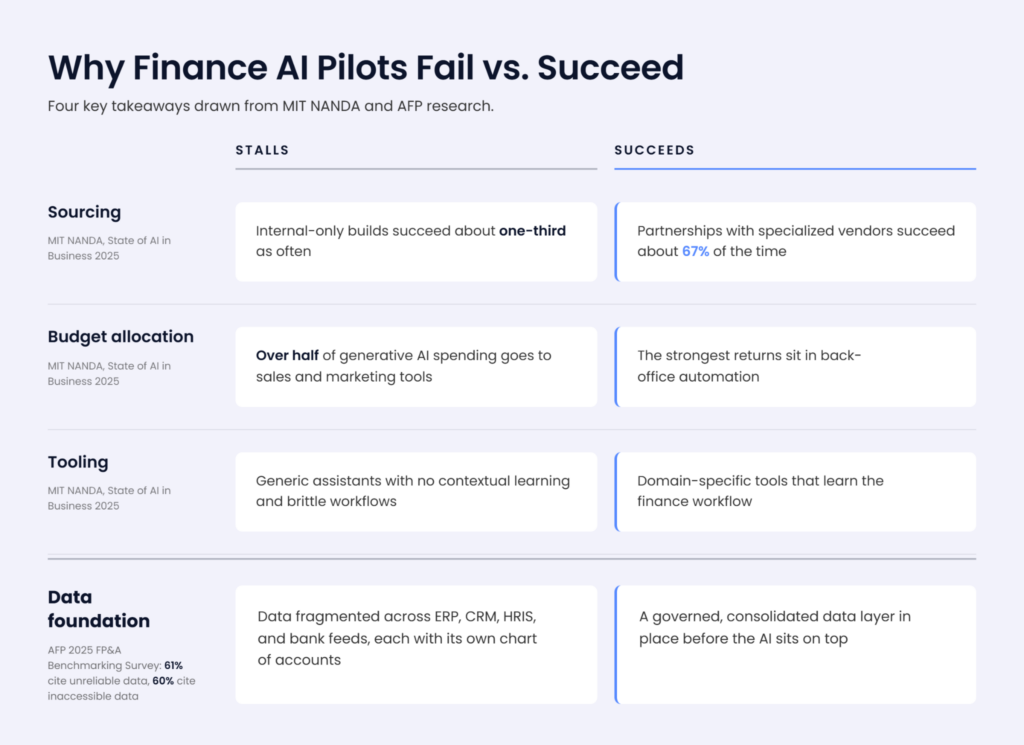
- Budget allocation runs backward: More than half of generative AI spending goes to sales and marketing tools, while the strongest returns sit in back-office automation.
- Generic tools stall on domain work: General-purpose assistants meet workflows they cannot learn, and enterprise deployments get abandoned after evaluation.
- Sourcing carries the largest single effect: Partnerships with specialized vendors succeed about 67% of the time, while internal-only builds succeed about 33% of the time.
Those findings describe the pattern across every function. Ask why AI pilots fail inside the finance team specifically, and a more precise cause sits underneath all three.
Fragmented and ungoverned financial data
Finance professionals name this themselves. In the 2025 AFP FP&A Benchmarking Survey on technology and data, 61% identified unreliable data as the primary obstacle to technology success and 60% identified inaccessible data. Both ranked above skills and above the tools themselves.
That is the condition most finance AI pilots launch into:
- Actuals sit in the ERP, pipeline in the CRM, headcount in the HRIS, and balances in bank feeds, each with a different chart of accounts, entity structure, and refresh cadence.
- A model pointed at that estate returns answers that are technically derived and financially wrong.
- The finance team then spends the pilot period reconciling outputs instead of acting on them, and the initiative ends.
A governed data layer such as FinanceOS addresses this by consolidating and mapping every source first, with integrations keeping the refresh current, so the AI reads finance-adjusted numbers.
Generic tools applied to domain work
A general-purpose assistant handles an individual analyst task well and struggles with a recurring finance process. It has no memory of last quarter’s allocation logic, no view of the entity structure, and no way to learn how the team handles a specific accrual.
MIT identified brittle workflows and missing contextual learning as the reason enterprise deployments get abandoned after evaluation.
Internal-only builds without domain partnership
The 67% versus 33% gap is the sharpest number in the MIT research, and it lands hardest in regulated industries where teams default to building proprietary systems.
Finance-specific knowledge, mapping logic, audit requirements, and ongoing maintenance all sit outside what most internal teams can sustain past the first version.
Budget concentrated on the front office
Sales and marketing pilots are visible, easy to fund, and easy to demo. Back-office work is where MIT located the strongest returns, through reduced outsourcing, lower agency costs, and streamlined operations. Finance often ends up bidding for whatever remains of the AI budget after the more visible functions have taken their share.
How to Measure AI ROI in Finance Correctly
A defensible way to measure AI ROI in finance needs four things in place before deployment. These include:
- A strong baseline first: Record current cycle times, error and restatement rates, and hours spent per process before anything is switched on. Most stalled pilots cannot prove impact because nobody captured the starting point.
- Measure cycle time and error rate: Both are objective, already tracked, and don’t depend on a user survey. Time to close, time to budget, and the number of reopened periods are the strongest candidates.
- Use fully loaded cost: License cost, implementation time, internal hours, and any consulting spend all belong in the denominator. Published pricing is the starting figure, not the full figure.
- Track one process end to end: Pick a single workflow such as variance analysis and follow it from data pull through to commentary. A measured result on one process makes a stronger board case than an estimate spread across five.
Set the measurement window before the pilot begins, and make it at least two full cycles. A single close or a single budget round carries too much noise from the learning curve to represent steady-state performance.
How to Be in the 5% of Finance AI Implementations That Work
The research points to a consistent set of conditions common to a successful finance AI implementation. None of them are about model selection.
Here are the things you should focus on:
- Govern the data before layering AI on top: Consolidation, mapping, and a single source of truth come first. Every other item here depends on it.
- Scope to one domain process: One report, one reconciliation, one forecast. Tight scope produces a measurable result inside a quarter and gives the expansion case something concrete to stand on.
- Partner with a domain-specific vendor: The 67% success rate for specialized vendor partnerships is the most actionable finding in the MIT data, and it runs against the instinct to build in-house.
- Baseline and measure from day one: A pilot without a before-and-after measurement produces an opinion, and opinions do not survive a budget review.
- Adopt rolling forecasts: The 2026 AFP benchmarking data shows only 43% of organizations use them, despite their standing as a best practice for agility. Automation attached to a continuous cycle compounds in a way that annual automation never does.
Finance teams that have worked through this sequence describe the same order of events. Consolidation and governance land first, the reporting cycle compresses, and only then does the AI layer start producing analysis anyone trusts enough to act on. Datarails’ customer stories follow that arc closely.
See What Governed Financial Data Does to Your AI Output
Datarails connects your ERP, CRM, HRIS, and banking data into one governed source of truth, then puts AI on top of numbers your team has already validated. All without leaving Excel.
How Datarails Grounds AI in Governed Financial Data
The evidence points to infrastructure, and Datarails built FinanceOS to sit exactly there. It consolidates and maps data from 600+ systems into a single governed layer, with version control, audit trails, permission settings, and centralized business logic. Finance teams keep the Excel models they already trust, and the manual collection work around those models comes off their plate.
The FinanceOS AI Connector operates like a finance MCP. It connects Claude, ChatGPT, and Copilot directly to that governed data, with built-in permissions and an audit trail on every request, so an answer from a general-purpose assistant traces back to numbers finance has already validated.
Learn more about the architecture and how FinanceOS connects data to AI.
Datarails AI adds three purpose-built agents on top of that layer:
- The Reporting Agent analyzes actuals to uncover drivers and explain what moved.
- The Planning Agent supports fast, ad hoc forecasting and scenario analysis without rebuilding models.
- The Strategy Agent works forward, turning financial data into options and recommendations for the decisions ahead.
Insights delivers configured summaries on a schedule the team sets, and Storyboards turns results into presentation-ready narrative.
Zach Morgan, CFO at United Electric Cooperative, described the outcome in terms a board understands. Datarails gave the team visibility it had never had, and one insight alone saved about $2 million a year.
The ROI Is Real Where the Data Is Governed
The ROI of AI in finance is documented, repeatable, and measurable wherever teams have done the measuring honestly. Cycle time compresses. Reconciliation work shrinks. Analysts move from collection to analysis.
The failures are just as well documented, and they trace back to infrastructure rather than ambition. Pilots stall on fragmented data, generic tooling, and internal builds that cannot carry domain knowledge.
The good news is every one of those is fixable before the model becomes the question.
Put Your AI on Numbers Finance Has Already Validated
See how FinanceOS consolidates your financial and operational data into one governed source of truth, and what that does to the output of every AI tool your team already uses.
ROI of AI in Finance FAQs
Expect the ROI of AI in finance to show up in cycle time, error rates, and recovered analyst hours ahead of any headline percentage. Forrester’s model puts accounts payable automation at 111% ROI with payback under six months. Budgeting and close automation typically cut cycle time from weeks to days. The size of the return depends on how consolidated the underlying data is before AI is applied, which is the variable most organizations underestimate.
Cycle time is the primary return. AFP data puts the average budget at 8.7 weeks, with structured scenario planners finishing in 8.1 weeks. Organizations that consolidate inputs first report larger reductions, though the gains come as much from process and data changes as from the software.
Fragmented and ungoverned financial data is the primary cause, compounded by generic tools that cannot learn a finance workflow, internal-only builds without domain expertise, and budget allocated to front-office use cases where returns are weaker.
MIT NANDA found that 95% of enterprise generative AI pilots delivered no measurable P&L impact, leaving about 5% that did. Looking specifically at enterprise-grade systems, 60% of organizations evaluated them, 20% reached a pilot, and 5% reached production. Success rates rise sharply with sourcing, since partnerships with specialized vendors succeed about 67% of the time.
Baseline cycle times, error rates, and hours per process before deployment. Measure objective metrics ahead of user sentiment. Include implementation time and internal hours in the cost side alongside license fees. Run the measurement across at least two full cycles so the learning curve does not distort the result, and track a single process end to end instead of estimating across several
A governed data foundation in place before the AI layer, tight scope on a single domain process, partnership with a domain-specific vendor over an internal build, and a measured baseline established at the start. The MIT research found sourcing to be the strongest single differentiator, and the AFP data shows that process discipline matters as much as the technology.