Dashboarding
Embrace the notion that not everyone loves a spreadsheet as much as you do, and use graphs and charts to share the story of your data and collaborate with other teams
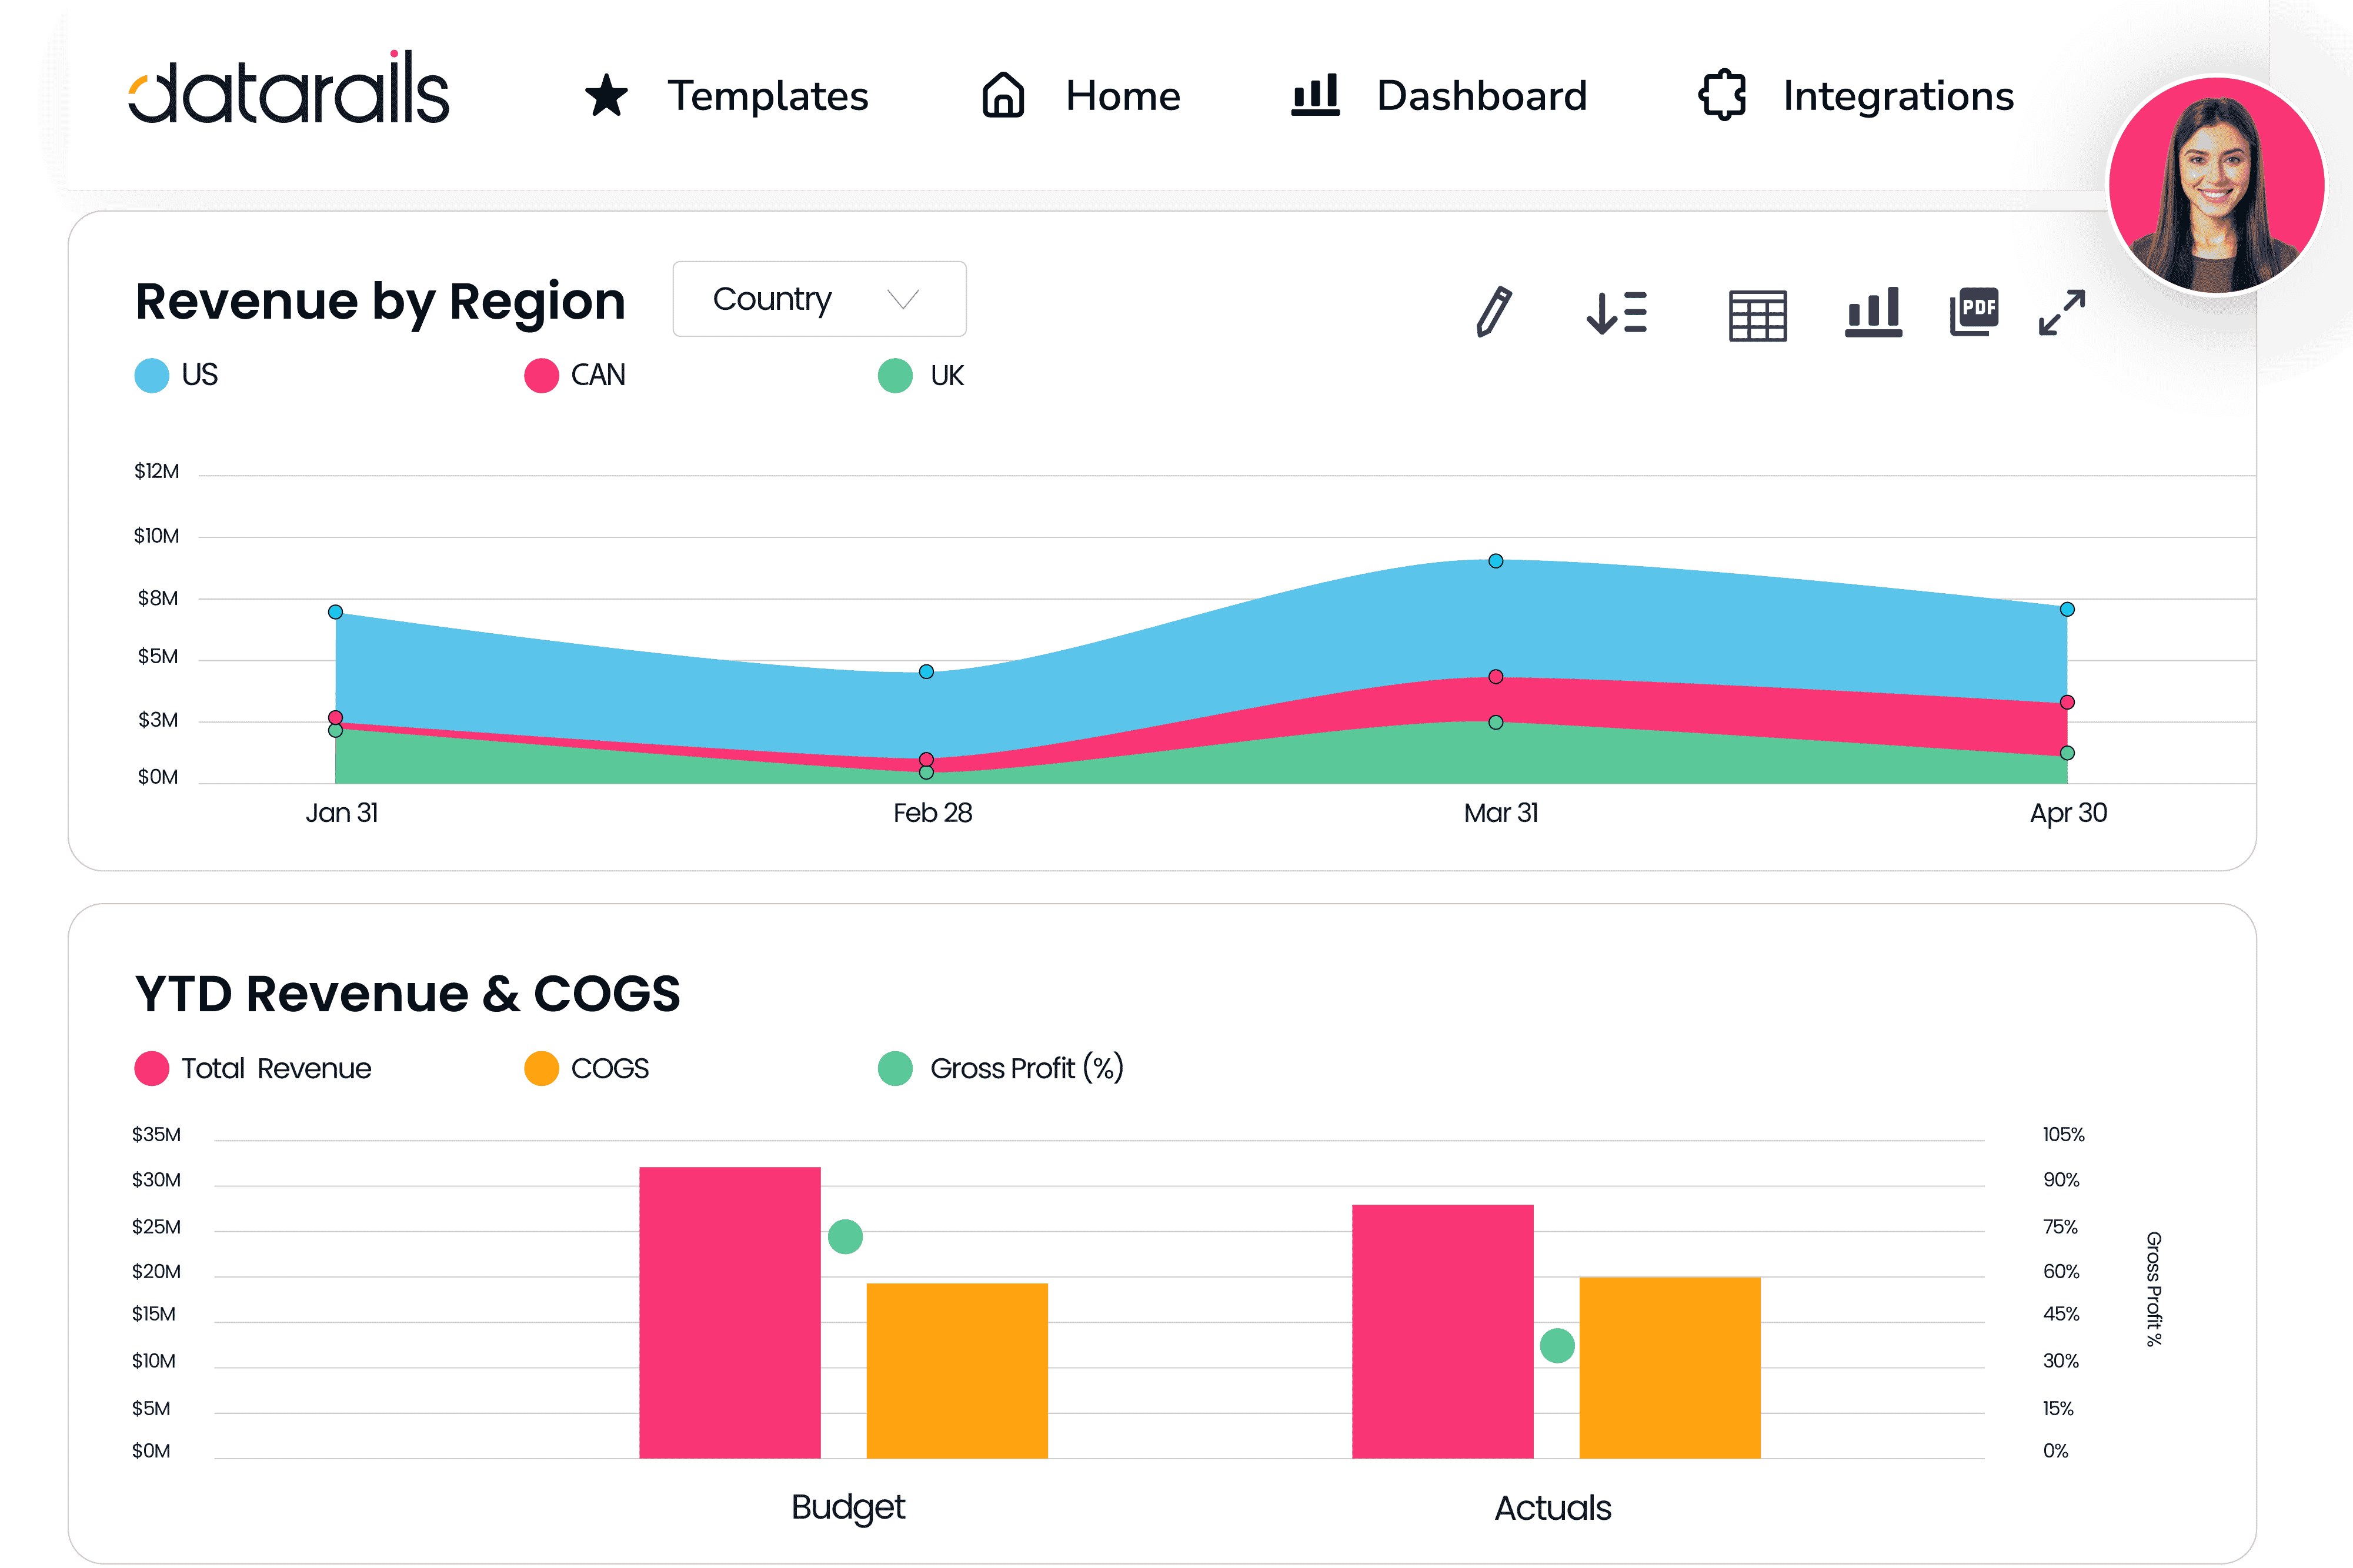
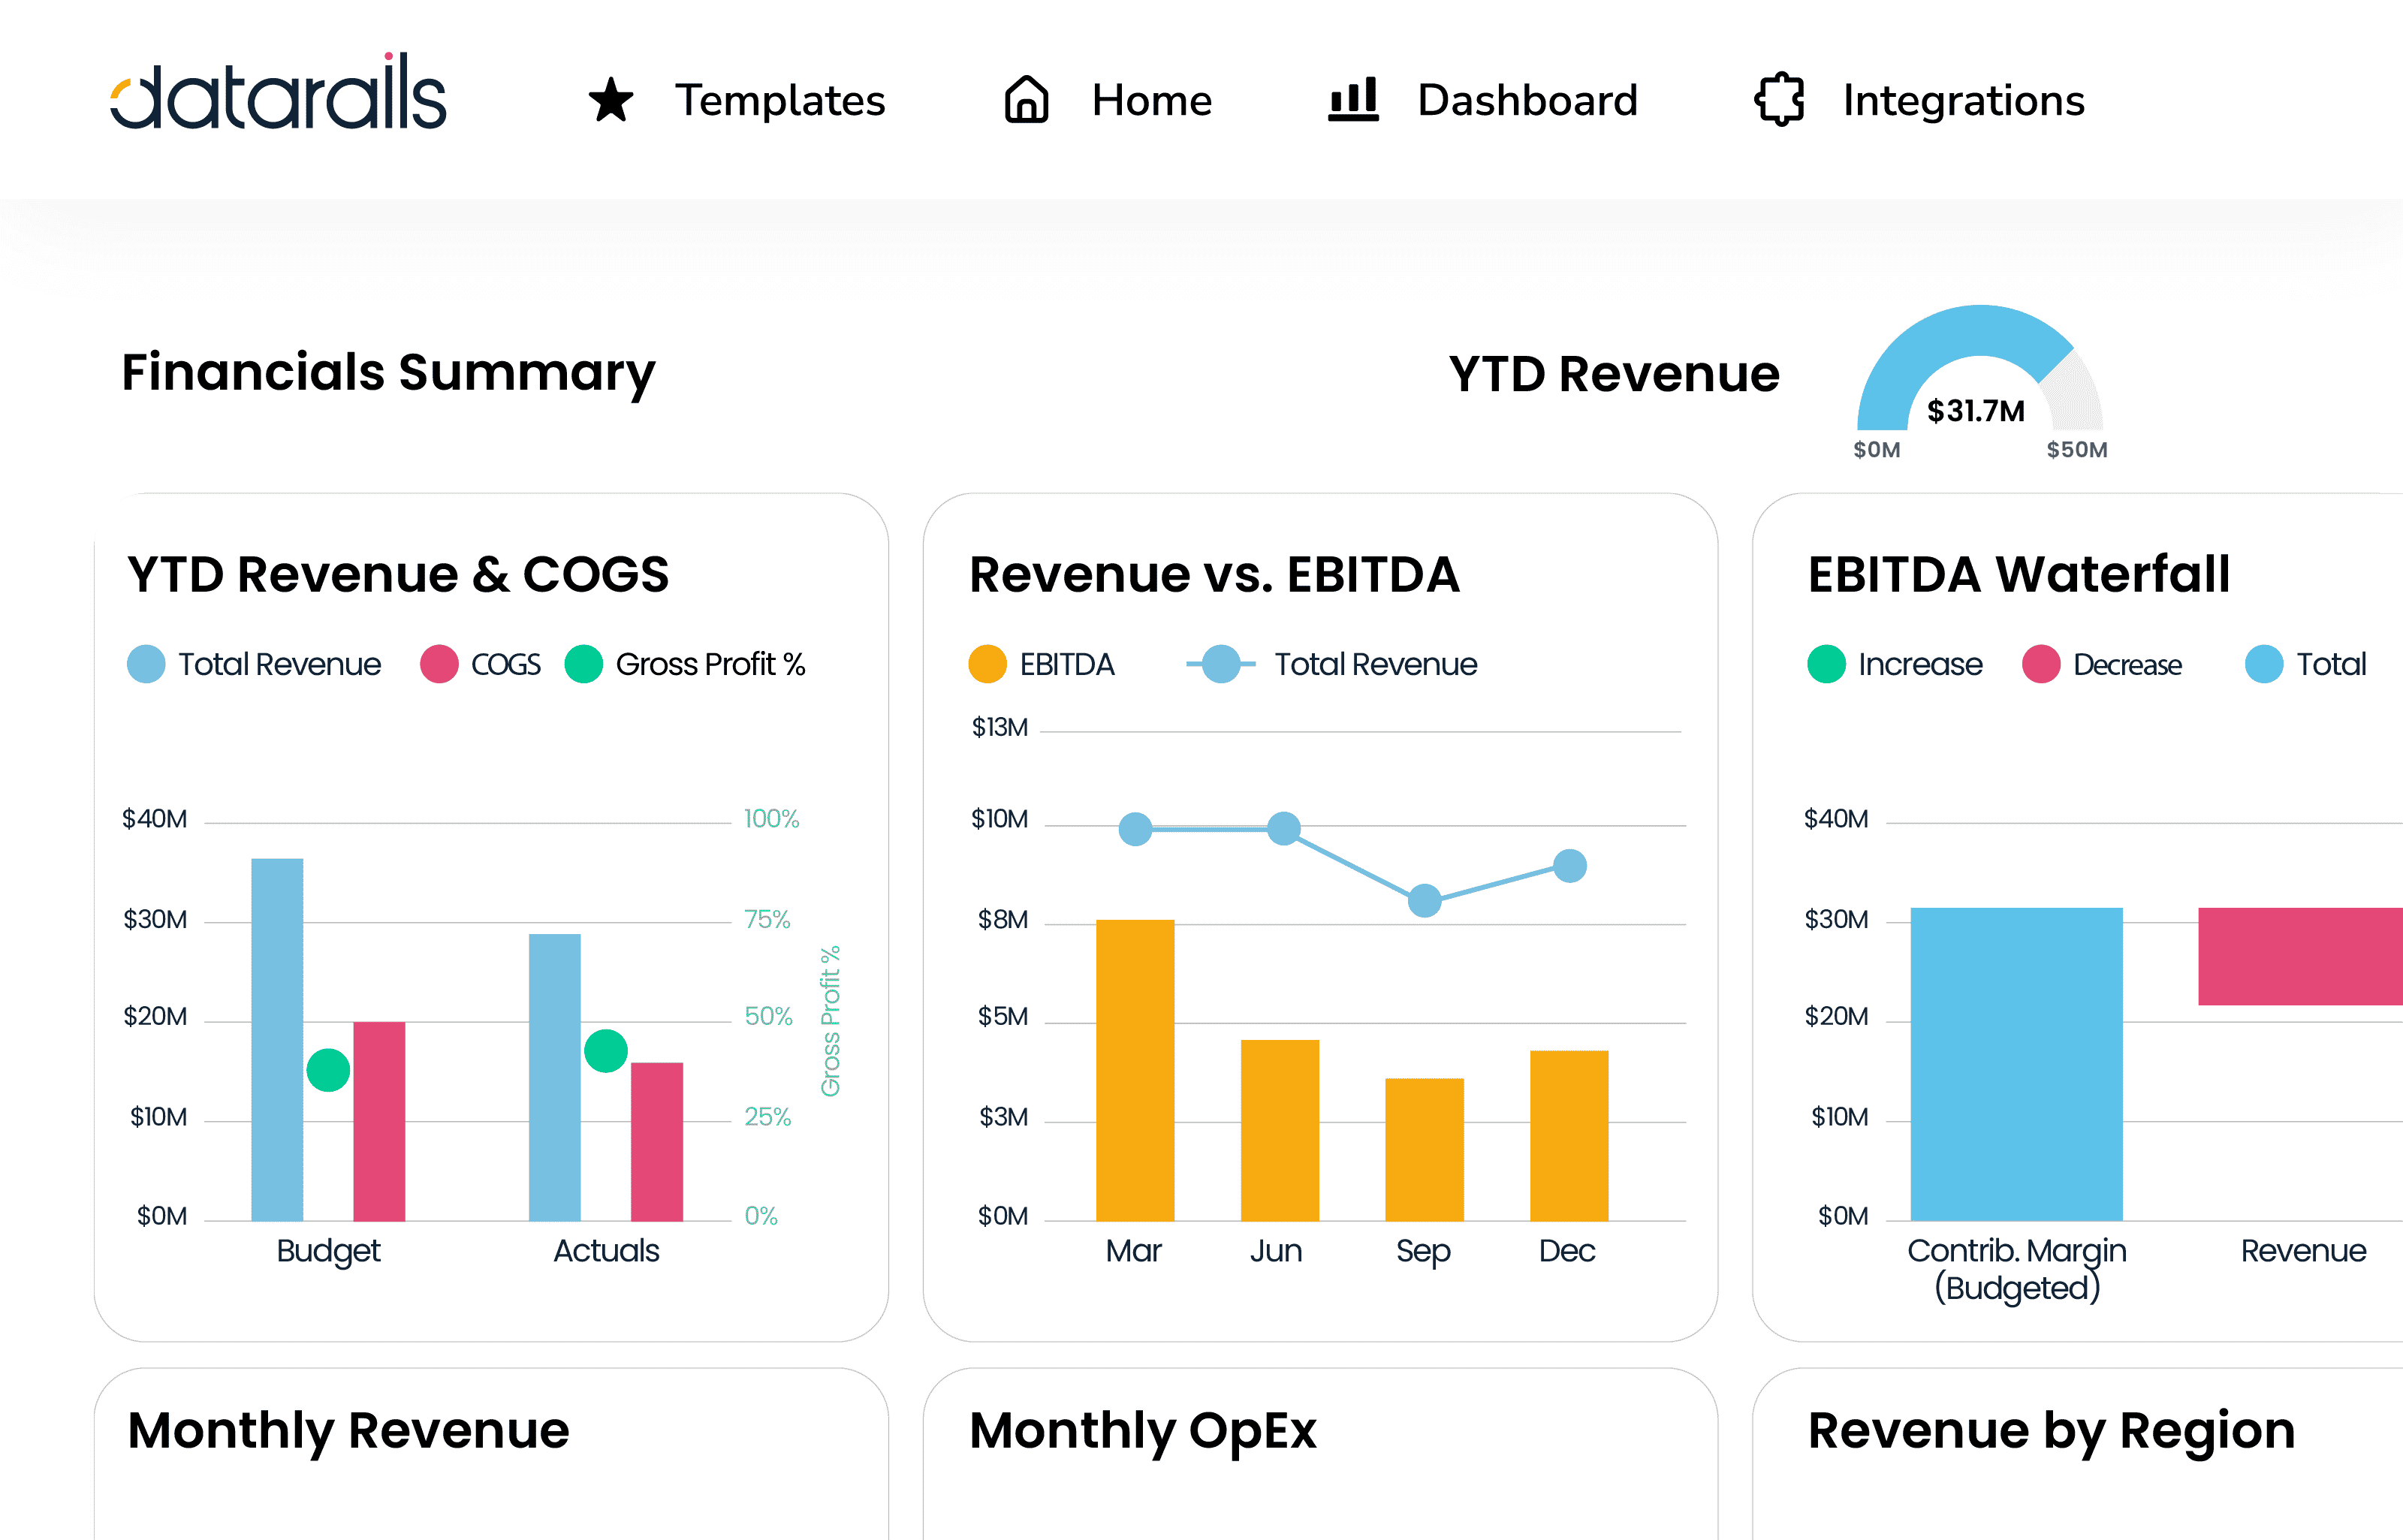
Visualize your data with live charts
Watch your data transform into live charts with embedded, real-time visualization. Compare any two or more metrics to better understand trends and cross-influence metrics.
Directly feed data to Excel or PowerPoint, or vice-versa
Datarails’ unique Microsoft Office-native integration pulls data from your database to Excel or PowerPoint. Watch as live, embedded charts update figures in real-time.
Schedule reports to be sent at your convenience
Send out dashboards to select individuals within the organization on a monthly basis without having to copy and paste the updated charts and tables.
“I look at the insights in Datarails every single day. That’s how I know how we’re doing on sales, on revenue, how I can look at trends and forecast what’s going to happen in the future.”Rob Anderson
Frequently Asked Questions
Financial dashboards are a tool that is used to keep track of and visualize KPIs, expenses, profits, sales, performance, and just about any other metric that an organization wants to keep tabs on. As finance professionals and FP&A analysts are under pressure to deliver more information and faster than ever before, they can leverage financial dashboards in order to uncover insights. Financial dashboards can help spot anomalies and detect changes that are worth analyzing and reporting.
Today, with tools such as Datarails, it’s easy to build a financial dashboard. Datarails’ web-based, real-time financial dashboards are customizable and let you visualize your data as you see fit.
Financial dashboards bring together and visualize an organization’s performance data in one place. By doing so, finance professionals can easily see what’s going on in their business, which makes it easier to detect anomalies or changes that are worth reporting on. Effective dashboards are able to draw meaningful correlations, deliver insights, and unearth variances in the numbers.
Companies should use financial dashboards as this is an excellent way to get a holistic picture of organizational performance, as well as view data in real time. With dashboards, finance professionals can validate numbers faster, drill down to discover variances, and detect specific points that need to be addressed.