Since its release in 1985, Microsoft Excel has proven that it is here to stay. Every industry and nearly every job function requires the use of an Excel spreadsheet at one point or another. The vast majority of companies continue to use Excel due to its advanced functionality, its speed, and because they simple recognize that it’s a great tool.
Data is frequently stored on Microsoft Excel spreadsheets. Unlike Google Sheets, Excel is packed with powerful features and capabilities, making it useful for collecting and managing data with a high degree of control and flexibility.
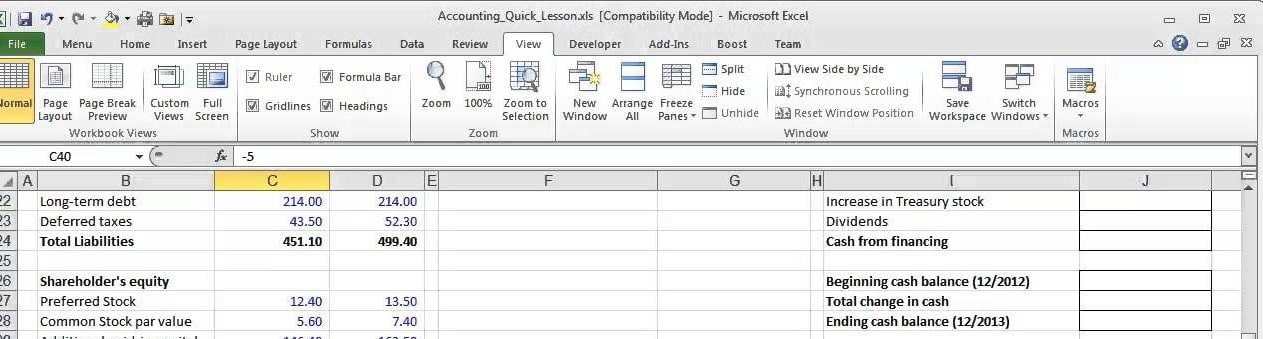
CFOs and other finance executives rely on spreadsheets on a regular basis to manage company finances including budgeting, quarterly reports, and in-depth analytics.
“If you take Excel away, the business is going to come to a stop. There’s no ifs, ands or buts about that.”
-Khaled Chowdhury, FP&A, KMG Chemicals
Despite its powerful capabilities, for finance teams working with Excel is far from perfect. One way for excel to improve its performance is with R1C1 Reference Style. Other than that, here are some things that can go wrong, and what you can do about it.
Broken templates
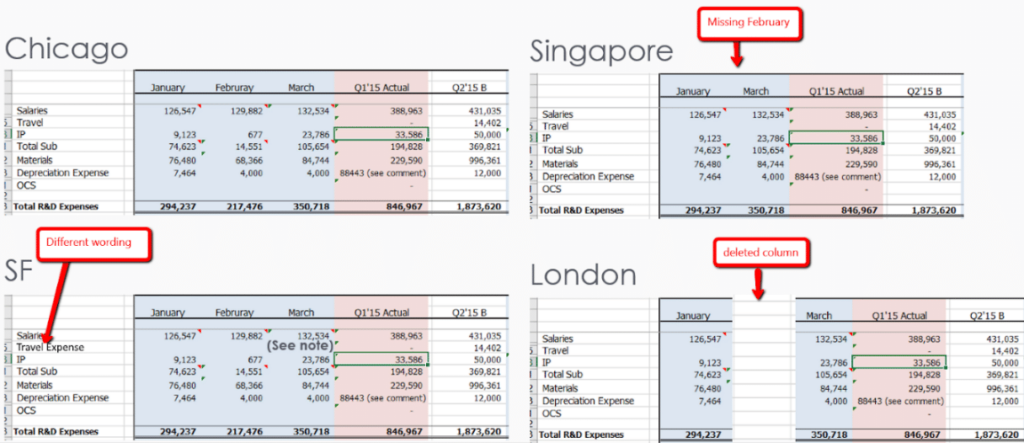
When Directors or VPs fill in templates, oftentimes they delete some of the original values, add or remove rows, or even change columns. In some cases, they even change the wording when inputting valuable information.
This is all good and well, but once the finance department copies all of that information into a main file (consolidated file), it’s possible they may copy and paste the wrong values as they are expecting a specific format and wording. This is a problem since the submitted file may in fact be different.
This can cause serious issues, such as copying the source Q2 data into Q3 output, or taking the software expense assumptions as an HR expense.
Insights and drill downs
As files hold vast amounts of data, during the consolidation process (copying and pasting the different site files into one big file) the finance team takes just the bottom line from each file and copies it into the consolidated one.
For example, for the Marketing file, even though the file holds detailed data about the different campaign expenses, the number of hires projected for the coming year, and even the give-aways they are planning to give in the upcoming event, the finance team copies only the bottom line of the expenses into the consolidated file.
This is perfectly fine in order to get the bottom lines ready for management, but… when management has questions about the details (for example, how much money is going to be spent on facebook campaigns by the marketing team) – this data will NOT be available in the report and the CFO will have to open the marketing file that was submitted in order to get this information.
Slow processes
As you can imagine, the process of sending out excel templates, collecting them, sending them back to get missing information, consolidating numerous files and eventually preparing required reports takes time. Usually, this takes a couple of months.
On top of that, the CFO will usually ask for some modifications to the data which sometimes requires the entire process to be redone. This sometimes means that the budget is ready after the year has started. Not good.
Traceability
Think of the poor finance Director that after consolidating numerous files and spending weeks on the process finds a mistake in the data. The chances of him locating the root cause of this error (that might be a simple calculation mistake in one of the files submitted to him from one of the sites) is slim to none.
As a result these errors tend to be ignored, and the sad fact is that this is one of the biggest secrets in the industry. Everyone knows that the budget/forecast is not 100% correct, but there is simply no way of addressing this after the fact…
Control
Think about the FP&A Director who is in charge of the entire budget/forecast process. He sends out a template to different sites and departments and then every few days needs to send reminder emails to make sure that people are working on them. He has no idea what the current status is and if he is on time or way behind it.
Manual Data Consolidation
One of the main drawbacks of working with Excel in Finance is that it lacks a reliable, flexible, and comprehensive way to consolidate data. To accurately combine data in Excel, each file and worksheet must meet certain requirements. The worksheets must share the same range of information in both axes, meaning that they match up identically. Once the ranges match in every worksheet, the program can generate a new worksheet that summarizes the data.
Unfortunately, this process is not appropriate in cases where massive amounts of data must be consolidated from different sources with different spreadsheets. In such cases, users must often manually compare and extract from spreadsheets to find relevant information.
Businesses that manually combine data are especially prone to errors, as one misplaced keystroke can have disastrous consequences. Such Excel horror stories are sadly quite commonplace.
For example, there’s the infamous tale of the London 2012 Olympics snafu, when 10,000 additional tickets to the synchronized swimming event were sold by mistake because of a spreadsheet error. Another such glitch occurred in 2014 when Tibco Software received $100 million less than it had originally expected due to a spreadsheet-based error.
What Can You Do About It?
As previously mentioned, despite its powerful capabilities, Excel is far from perfect.
We have established that while most data is stored on Excel spreadsheets and most businesses are familiar with Excel, the platform does not provide a comprehensive data consolidation solution. Consequently, the ideal solution for consolidating spreadsheet data involves seamlessly and automatically combining cells from different files within a Microsoft Excel environment.
This is where Datarails comes into play. With Datarails’ technology, data is automatically consolidated every time a user hits the save button when working on a spreadsheet. Backup spreadsheet files are automatically saved as well, so one can easily check when changes occurred and who made them. In addition, Datarails flags unusual activity, allowing for mistakes to be detected early on.
All of this is accomplished in the same Microsoft Excel environment that users know, understand, and are accustomed to.
Datarails continuously structures, stores, and updates all your Excel-based data on a cloud-based centralized database, resulting in built-in data integrity. Finally, you can easily understand where your numbers come from and trust that they’re accurate.
”[With Datarails] I now have a complete and comprehensive hands-off solution to manage my financial operations data,” Rob said, “which affords me additional control and a birds-eye view over the entire process.”
– Rob Grasso, Director of Sales Operations, Bauer Hockey
Conclusion
As quantities of data continue to grow in the digital world, the need for efficient ways to manage said data will concurrently increase as well. This is where Datarails comes in.
Datarails consolidates your numbers and provides instant insights into your data, all within your current Excel environment. With automatic consolidation, take control of your spreadsheets to make better business decisions. At last, you must no longer choose between what were once necessary manual processes and value-added work.
With Datarails’ effortless, automated, and accurate solution, spend less time putting the numbers together and more time thinking about what they mean.
About Datarails
Datarails is an enterprise-class software that empowers each finance professional to independently work with data and deliver actionable, data-driven insights. Finally, count on numbers you can trust and reduce inefficiencies without having to change how you work on Excel. With Datarails, strengthen the connection between finance and operations to drive better organizational decisions.