Transform the CFO's Office
Make the CFO’s office the home of business insights with the #1 AI-powered Excel-native FP&A platform.
What do you want to simplify today?


All your financial data. Governed, Connected, AI-ready.
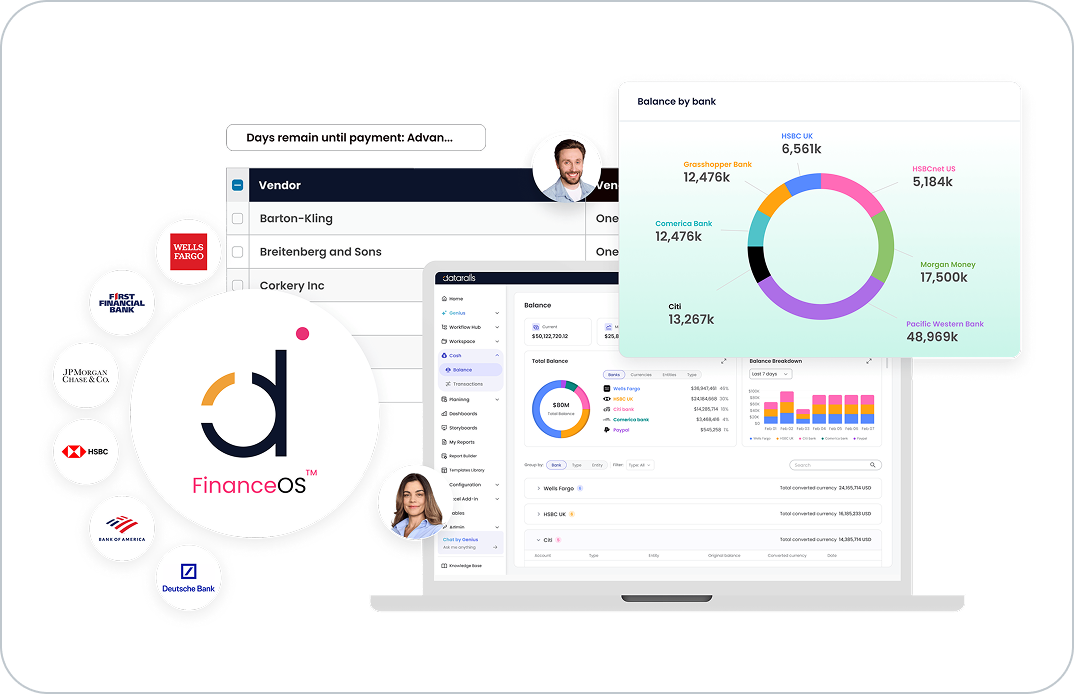
FinanceOS is your new finance operating system, connecting and consolidating every financial data source in your organization into a single, governed, secure, and AI-ready layer.
Make FinanceOS
your one source of truth.
Integrate with 200+ accounting software, ERP, CRM, Bank, or HRIS system so you can spend less time collecting data and more time analyzing it.


One Platform.
Endless Possibilities.

Datarails FP&A


Datarails Cash Management


Datarails Month-End Close


Datarails Connect
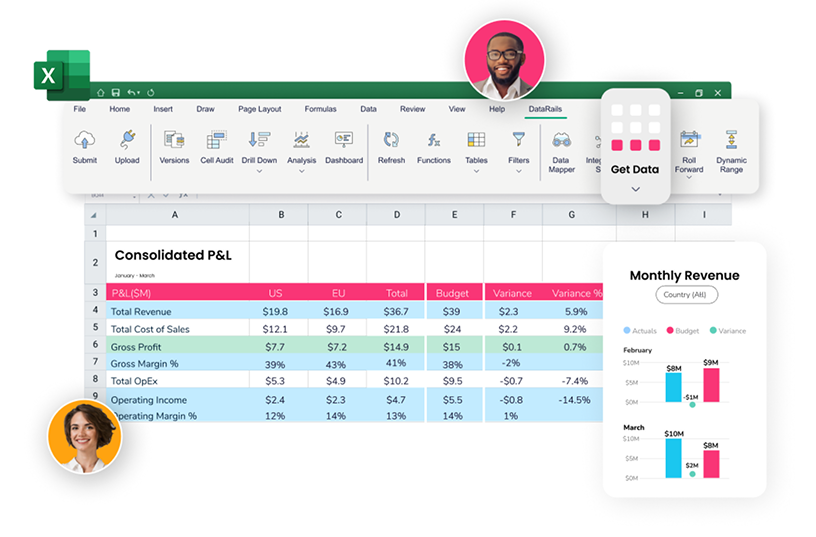
The flexibility of Excel.
The power of Datarails.
FinanceOS allows you to keep working in your Excel environment with 100% functionality. Automated consolidation and reporting saves you time, letting you focus on the strategic insights that drive business growth.
Let your data tell
the story
Improve decision-making on the finance team and beyond. Datarails’ visualization capabilities make it simpler to spot trends, variances, and anomalies, inspiring business decisions based on data from across the company
Datarails AI
The world’s first complete generative AI assistant for FP&A. Our AI tools let you spend less time on manual, repetitive work and more time on strategic analysis impacting your company.
Trusted by finance teams across many industries


Which tasks can Datarails help you with?

Data consolidation
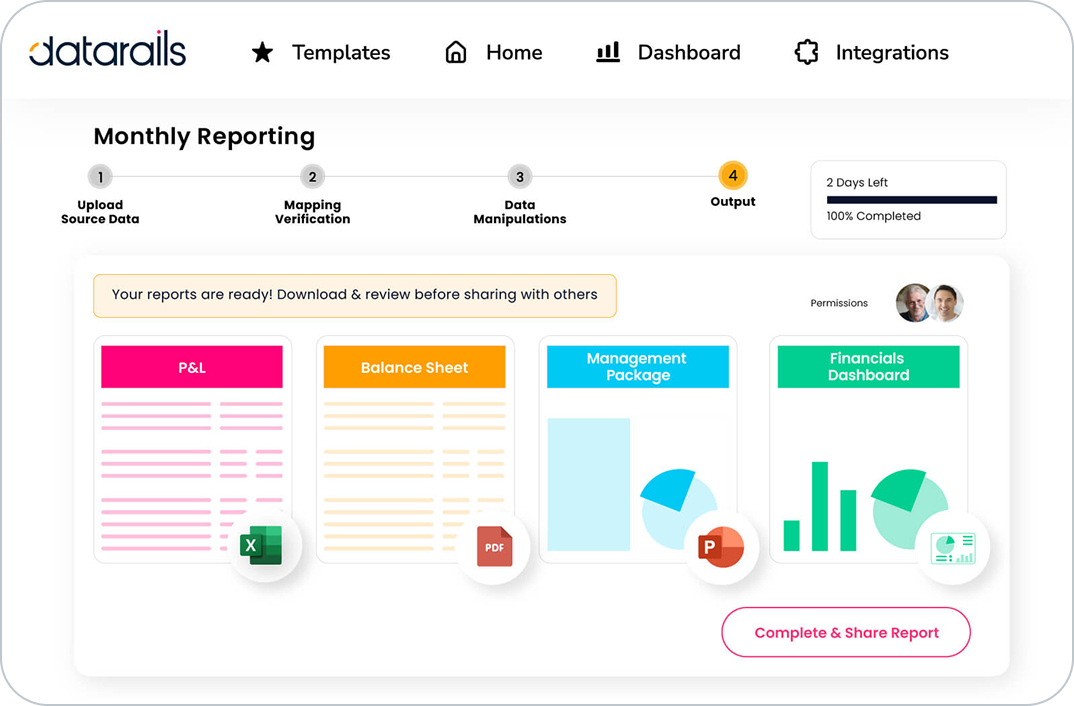
Financial Reporting

Budgeting

Data Analysis

ERP-Excel Connectivity
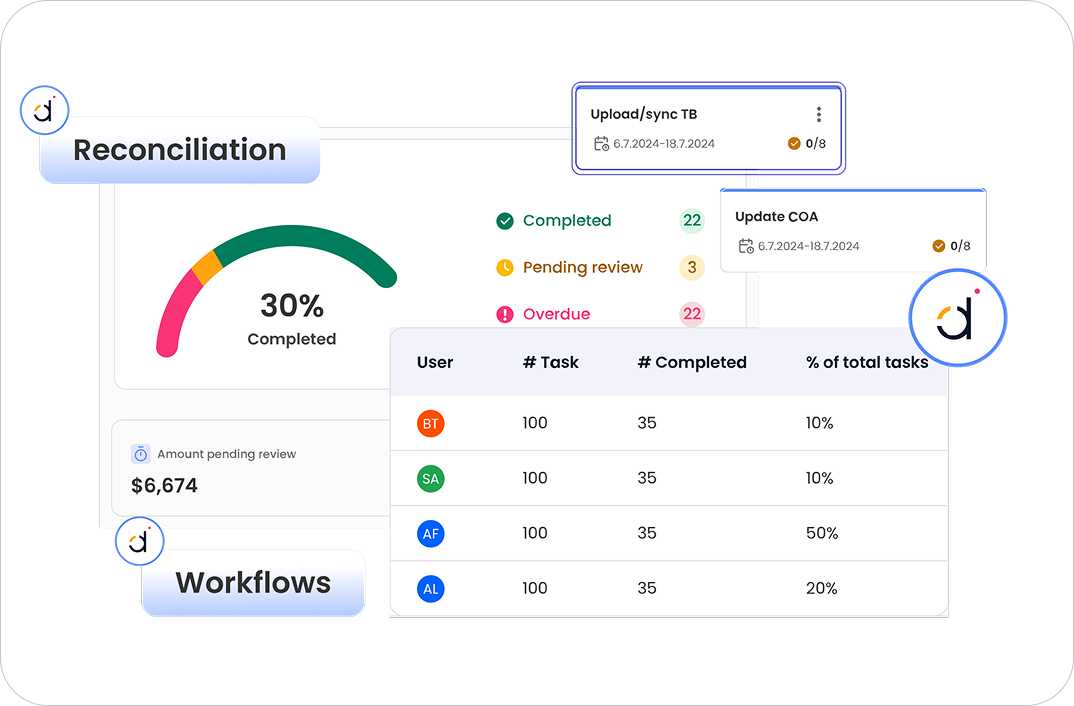
Month-End Close
Cash Management
Learn why finance teams choose Datarails