Click for Takeaways: Strategic Financial Ratio Insights
- CFO Analytical Focus: Over 70% of CFOs identify improved metrics and reporting as critical for 2025, placing financial ratios at the heart of the modern finance transformation strategy.
- Retention as a Multiplier: A mere 5% boost in customer retention can skyrocket profits by up to 95%, making the integration of CLV and efficiency ratios essential for calculating true business value.
- Experience-Driven Growth: Focusing on customer experience can lead to a 14% revenue lift, proving that profitability ratios are most effective when paired with customer-centric performance data.
- Working Capital Efficiency: Implementing real-time tracking and predictive forecasting can improve forecast accuracy by 20%, transforming ratio analysis into a tool for agile, daily decision-making.
- Cost Optimization Strategy: 56% of CFOs are prioritizing enterprise-wide cost targets for 2026, relying on efficiency ratios to maintain the delicate balance between lean operations and growth investments.
What are financial ratios?
Financial ratios are basic calculations using quantitative data from a company’s financial statements. They are used to get insights and important information on the company’s performance, profitability, and financial health.
Common financial ratios come from a company’s balance sheet, income statement, and cash flow statement.
Businesses use financial ratios to determine liquidity, debt concentration, growth, profitability, and market value.
Why are financial ratios so important?
Financial ratios are sometimes referred to as accounting ratios or finance ratios. These ratios are important for assessing how a company generates revenue and profits using business expenses and assets in a given period. Internal and external stakeholders use financial ratios for competitor analysis, market valuation, benchmarking, and performance management.
Often, financial ratios are considered the best indicator of a company’s financial health, which explains why it’s so important to understand these ratios and what their results mean.
Financial Ratios inside a business
Financial planning and analysis professionals calculate financial ratios for the following reasons for internal reasons, including:
● Measuring return on capital investments
● Calculating profit margins
● To assess a company’s efficiency and how costs are allocated
● Assessing a company’s efficiency and how costs are allocated
● Determining how much debt is used to finance operations
● Identifying trends in profitability
● Managing working capital and short-term funding requirements
● Identifying operating bottlenecks and assessing inventory management systems
● Measuring a company’s ability to settle debt and liabilities
According to a Gartner survey of 251 CFOs conducted in October 2024, metrics, analytics, and reporting ranked as the top priority for CFOs heading into 2025, reflecting an emphasis on delivering insights to improve business performance. This shift demonstrates how financial leaders increasingly rely on data-driven decision-making tools, with financial ratios serving as fundamental components of their analytical frameworks.
How analysts and external stakeholders use Financial Ratios
External stakeholders use financial ratios to:
● Carry out competitor analysis
● Determine whether to finance a company in the form of debt
● Assess how profitable a company is
● Determine whether to provide equity financing or buy shares in the company
● Calculate tax liabilities
● Measure a company’s market value
● Calculate return on shareholders’ equity
● Perform market analysis
Financial Ratios Excel Template
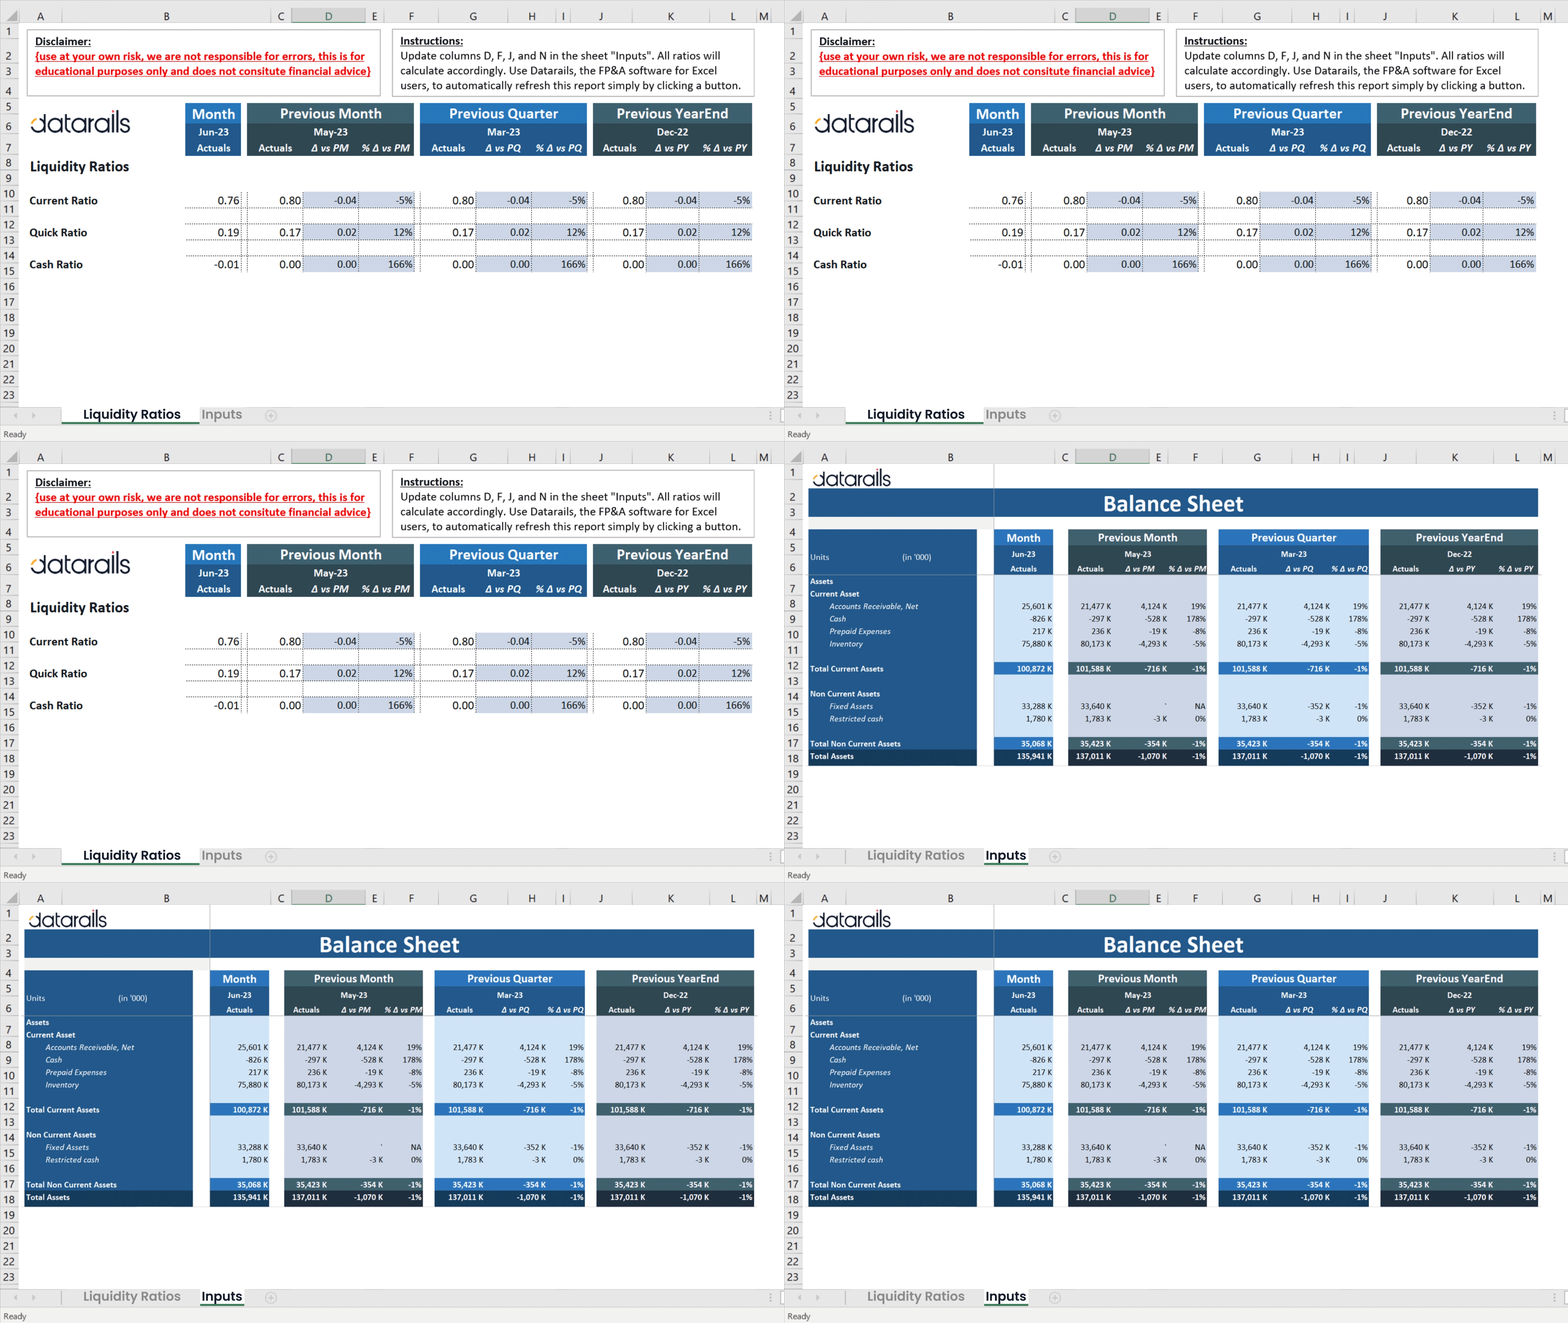
Below is an Excel template with all of the formulas needed for calculating each of the 5 financial ratios.
Plug in your company’s numbers and get a quick and accurate picture of where you stand on liquidity, debt concentration, growth, profitability, and market value.
5 Essential Financial Ratios for Every Business
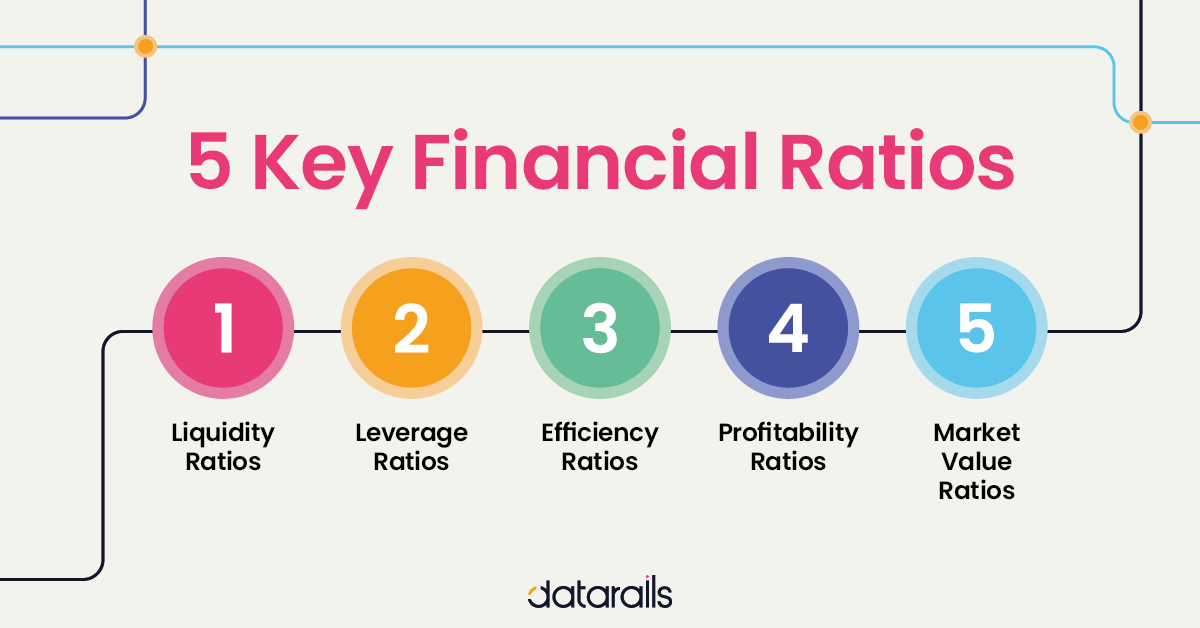
The common financial ratios every business should track are
1) liquidity ratios
2) leverage ratios
3)efficiency ratio
4) profitability ratios
5) market value ratios
Let’s explore each of these key ratios in more detail.
1) Liquidity ratios
Companies use liquidity ratios to measure working capital performance – the money available to meet your current, short-term obligations .
Simply put, companies need liquidity to pay their bills.
Liquidity ratios measure a company’s capacity to meet its short-term obligations and are a vital indicator of its financial health.
Liquidity is different from solvency, which measures a company’s ability to pay all its debts. In the sporting world, Italian football club Lazio faces a now-infamous liquidity ratio preventing it from signing new players. Italian clubs are required to communicate their liquidity indicator to the football authorities twice a year.
This indicator cannot be any lower than a certain threshold set by the football authorities.
There are different forms of liquidity ratio.
Current ratio: Current Assets / Current Liabilities
The current ratio measures how a business’s current assets, such as cash, cash equivalents, accounts receivable, and inventories, are used to settle current liabilities such as accounts payable.
Quick ratio (Acid-test ratio): (Current Assets – Inventories – Prepaid Expenses) / Current Liabilities
This ratio excludes inventories from current assets but includes:
Cash
Cash equivalents
Accounts receivable
A quick ratio of one is considered the industry average. This number suggests that a company may not be able to meet its current obligations because it has insufficient assets to liquidate.
The acid test is a quick and simple test gold miners used to determine whether samples of metal were true gold or not. Acid is added to a sample; if it dissolves, it isn’t gold. If it stands up to the acid, it likely is.
Quick Ratio Example: Apple (NASDAQ: AAPL)
From a great real example on the Street.com see how Apple’s Quick Ratio stacks up:
The following figures are from March 31, 2024, and come from Apple’s balance sheet. Numbers are in millions of dollars.
Cash and cash equivalents: $32,695
Accounts receivable: $33,410
Marketable securities: $91,479
Current liabilities: $176,392 ($32,695 + $33,410 + $91,479) / $176,392
- QR = Liquid Assets / Current Liabilities
- QR = ($32,695 + $33,410 + $91,479) / $176,392
- QR = $157,584 / $106,385
- QR = .89%
Based on this calculation, Apple’s quick ratio was 0.89% as of March 2024. This number could be higher if more assets were included in its calculations.
See NetGuru’s calculation of Apple’s QR for September 2024 here.
Cash Ratio: Cash and Cash Equivalents / Current Liabilities
The cash ratio measures a business’s ability to use cash and cash equivalents to pay off short-term liabilities. It shows how quickly a company can settle current obligations.
2) Leverage ratios
Companies often use short and long-term debt to finance business operations.
Leverage ratios measure a company’s debt. According to the Wall Street Journal, Molson Coors Beverage Co., the maker of Coors Light and Miller Lite beer, was saddled with debt after an industry acquisition.
CFO Tracey Joubert signaled to the market that the company plans to “reduce its leverage ratio to below three times by the end of this year.”
The types of leverage ratios to consider are:
Debt ratio: Total Debt / Total Assets
The debt ratio measures the proportion of debt a company has to its total assets. A high debt ratio indicates that a company is highly leveraged.
Debt to equity ratio: Total Debt / Total Equity
The debt-to-equity ratio measures a company’s debt liability compared to shareholders’ equity. This ratio is important for investors because debt obligations often have a higher priority if a company goes bankrupt.
Interest coverage ratio: EBIT / Interest expenses
Companies generally pay interest on corporate debt. The interest coverage ratio shows if a company’s revenue after operating expenses can cover interest liabilities.
Don’t miss this article next: Revenue vs. Profit: Differences and Importance.
3) Efficiency ratios
Efficiency ratios show how effectively a company uses working capital to generate sales. For instance, Business Wire reports that Seattle-based bank Washington Federal’s company’s efficiency ratio for the third fiscal quarter of 2024 was 55.7%, compared to 58.5% (as adjusted in the prior quarter) and 51.9% for the same period in 2023.
A fall in the efficiency ratio indicates improved profitability. There are several ways to analyze efficiency ratios:
Asset turnover ratio: Net sales / Average total assets
Companies use assets to generate sales. The asset turnover ratio measures how much net sales are made from average assets.
Inventory turnover: Cost of goods sold / Average value of inventory
For companies in the manufacturing and production industries with high inventory levels, inventory turnover is an important ratio that measures how often inventory is used and replaced for operations.
Days sales in inventory ratio: Value of Inventory / Cost of goods sold x (no. of days in the period)
Holding inventory for too long may not be efficient. The day sales in inventory ratio calculates how long a business holds inventories before they are converted to finished products or sold to customers.
Payables turnover ratio: Cost of Goods sold (or net credit purchases) / Average Accounts Payable
The payables turnover ratio calculates how quickly a business pays its suppliers and creditors.
Days payables outstanding (DPO): (Average Accounts Payable / Cost of Goods Sold) x Number of Days in Accounting Period (or year)
This ratio shows how many days it takes a company to pay off suppliers and vendors. A lower days payables outstanding implies that a business is letting go of cash too quickly and may not be taking advantage of longer credit terms. On the other hand, when the DPO is too high, it means a company delays paying its suppliers, which can lead to disputes.
Receivables turnover ratio: Net credit sales / Average accounts receivable
Accounts receivables are credit sales made to customers. It is important that companies can readily convert account receivables to cash. Slow paying customers reduce a business’s ability to generate cash from their accounts receivable.
The receivables turnover ratio helps companies measure how quickly they turn customers’ invoices into cash.
A high receivables turnover ratio shows that a company quickly generates cash from accounts receivables.
A Gartner survey of more than 200 CFOs conducted in August 2025 revealed that 56% of CFOs rank achieving enterprise-wide cost optimization targets in their top five priorities for 2026. This focus on cost management directly ties to the importance of efficiency ratios, which measure how effectively companies use assets and manage expenses.
The survey also found that 51% of CFOs prioritize improving financial forecast accuracy, demonstrating how efficiency ratios and leverage ratios work together to help CFOs balance cost control with strategic growth investments during periods of economic uncertainty.
4) Profitability ratios
A business’s profit is calculated as net sales less expenses. Profitability ratios measure how a company generates profits using available resources over a given period.
Higher ratio results are often more favorable, but these ratios provide much more information when compared to results of similar companies, the company’s own historical performance, or the industry average.
Some of the most common profitability ratios are:
Gross margin: Gross profit / Net sales
The gross margin ratio measures how much profit a business makes after the cost of goods and services compared to net sales.
Comparing companies can be illustrative – such as finding that Home Depot has a 33.39% gross profit margin versus Walmart’s 25.11%.
Operating margin: Operating income / Net sales
The operating margin measures how much profit a company generates from net sales after accounting for the cost of goods sold and operating expenses.
Return on assets (ROA): Net income / Total assets
Companies use the return on assets ratio to determine how much profits they generate from total assets or resources, including current and noncurrent assets.
Return on equity (ROE): Net income / Total equity
Shareholders’ equity is capital investments. The return on equity measures how much profit a business generates from shareholders’ equity.
For instance a company with a declining ROE could be seen as having more risk than a company in the same industry with an increasing ROI.
According to Forrester, companies that focus on customer experience using Customer Lifetime Value (CLV) insights achieve a 14% revenue lift compared to those that don’t. This illustrates how profitability ratios extend beyond traditional metrics like gross margin and return on equity.
Modern CFOs increasingly integrate customer-centric metrics with financial ratios to gain a comprehensive view of performance, demonstrating that profitability analysis must encompass both operational efficiency and customer relationship value.
5) Market Value ratios
Market value ratios are used to measure how valuable a company is.
These ratios are usually used by external stakeholders such as investors or market analysts. However, internal management can also use them to monitor value per company share.
On the topic of stakeholders, read this article next: Communication Strategies for Presenting Budget Forecasts with Stakeholders.
Earnings per share ratio (EPS): (Net Income – Preferred Dividends) / End-of-Period Common Shares Outstanding
The earnings per share ratio, also known as EPS, shows how much profit is attributable to each company share.
Price earnings ratio (P/E): Share price / Earnings per share
The PE ratio is a key investor ratio that measures how valuable a company is relative to its book value earnings per share.
Book value per share ratio: (Total Equity – Preferred Equity) / Total shares outstanding
A company’s common equity is what common shareholders own after all liabilities and preference shares have been settled from total assets.
The book value per share measures the value per share for common equity owners based on the balance sheet value of assets less liabilities and preference shares.
Dividend yield ratio: Dividend per share / Share price
The dividend yield ratio measures the value of a company’s dividend per share compared to the market share price.
Customer retention is one of the most powerful drivers of long-term profitability — and market value ratios help CFOs quantify exactly why. Foundational research by Frederick Reichheld at Bain & Company established that even a 5% improvement in customer retention can increase profits significantly – by 25% or more in financial services, and up to 95% in other industries, depending on customer acquisition costs and lifetime spend.
This is precisely why metrics like Customer Lifetime Value (CLV) have become critical for finance leaders to track. When CFOs combine CLV with operational efficiency ratios, such as asset turnover and receivables turnover, they get a fuller picture of sustainable growth, connecting what it costs to acquire and serve customers with the long-term value those customers actually deliver.
When companies pay out dividends to shareholders, the value of dividends received for each share owned is known as the dividend per share. Shareholders and analysts compare the dividend per share to the company’s share price using the dividend yield ratio.
Best Practices For Using Financial Ratios
Financial ratios help senior management and external stakeholders measure a company’s performance. These best practices will drive effective decision-making.
● Compute financial ratios with accurate financial numbers
● Compare ratios across periods to identify performance trends
● Use relative competitor and industry benchmarks to measure performance
● Calculate ratios using balance sheet averages where applicable
● Interpret financial ratios correctly to support key business decisions
● Calculate and analyze ratios using the balance sheet, income statement, and cash flow statement to get a holistic view of the business’s performance.
According to Phoenix Strategy Group’s analysis of CFO dashboard practices, businesses that implement real-time cash flow forecasting can reduce working capital needs by 15–20% through better timing of payments and collections. Advanced technology, including data analytics tools and cloud-based financial software, enables CFOs to access instant insights on liquidity ratios, profitability metrics, and variance analysis.
This technological shift has transformed financial ratio analysis from a periodic review process into a continuous monitoring system that supports agile decision-making and rapid response to market changes.
Final Thoughts: Using These Ratios to Your Advantage
Financial ratios are useful key performance indicators that measure a company’s performance over time compared to its competitors and the industry.
Calculating accurate financial ratios and interpreting the ratios help business leaders and investors make the right decisions.
You need accurate, real-time data to ensure your calculations are accurate to make effective decisions. That’s precisely what Datarails offers you.
With features like data visualization and real-time financial reporting, you can be entirely confident in your data and your decisions.
Financial Ratio FAQs
Key financial ratios include liquidity, profitability, efficiency, leverage, and valuation ratios. These ratios provide a snapshot of business performance.
Financial ratios help compare results over time, identify risks, and evaluate operational efficiency across businesses.
Businesses should track important financial ratios related to cash flow, margins, debt, and asset efficiency.
Most companies review financial ratios monthly or quarterly as part of regular reporting and forecasting.
Yes, financial ratios are essential for small businesses to monitor cash flow, profitability, and financial health.