Did you know that to better comprehend the financial positioning of a business or corporation, all you have to do is a few quick calculations using the data found on an organization’s balance sheet?
The balance sheet is only one part of a company’s consolidated financial statements. However, it gives you a sense of how healthy a business is at an exact moment in time. So, whether you are a potential investor, a current business owner, or a financial manager, you know that there are almost no financial statements more critical than the balance sheet.
And, because a balance sheet is a snapshot of how your business is doing, it’s crucial to know your way around one and be able to parse the info it provides. So here is your balance sheet explained.
What is a Balance Sheet Report?
A statement of financial position, also commonly known as a balance sheet, is a financial report that outlines a company’s assets, liabilities, and shareholders’ equity for a particular period of time. Essentially, a balance sheet provides a picture of what the organization owes and owns for a particular time frame. This is important, as the balance sheet report reflects the organization’s financial status quo.
Why Every Business Needs a Balance Sheet
Generally speaking, one can measure the strength of a company by looking at three broad categories of investment-quality metrics: working capital, asset performance, and capitalization structure.
Working Capital
Working capital refers to the difference between an organization’s current assets (i.e., cash, investments, annual revenue) and current liabilities (i.e., payables owed to suppliers). Working capital is an indication of an organization’s cash conversion cycle and an indication of how well a company can manage two very important assets — accounts receivable and inventory.
Asset Performance
Asset performance is the ability to take operational resources, manage them, and produce profitable returns. The return on assets (ROA) ratio serves as a metric for determining the asset performance of an organization.
Capitalization
Capitalization refers to the amount of debt compared to the equity that a company has on its balance sheet.
To truly understand how a business performs, you must first understand the balance sheet and how to find a business’s working capital, asset performance, and capitalization.
What Are the Components of Balance Sheet Report?
A balance sheet is a snapshot in time rather than a representation of long-term fiscal trends. However, comparing your balance sheet with previous ones can help you parse those long-term trends and results as well.
Here are the elements and components of a balance sheet and how they work.
Assets
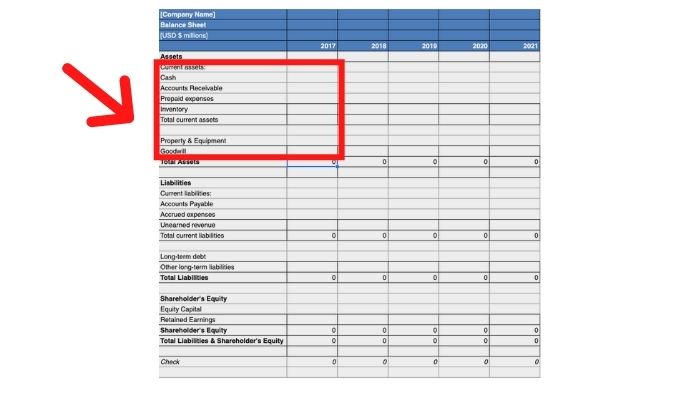
The asset section represents what an organization owns that can be converted into cash if needed. This section is broken into subsets and is listed on the balance sheet in order of liquidity, as such:
- Cash and cash equivalents
- Accounts receivable
- Prepaid expenses
- Inventory
- Fixed assets (i.e., property)
Assets can be further broken down into sub-categories such as:
- Current assets – Assets that may take up to a year to be converted to cash (i.e., accounts receivable, inventory, etc.).
- Long-term assets – These require more than a year to get your money’s worth (i.e., real estate).
Let’s say you own a fancy chocolate business called “Gold Mountain,” and as of January 2020, your assets, in order of liquidity, are:
- Bank account: $1,025
- Accounts Receivable: $3,050
- Supplies/Inventory: $450
Your balance sheet report would look something like this:
Liabilities
Next up on your balance sheet, you’ll see your liabilities (i.e., what a business owes others). Liabilities, like assets, are classified as current (due within a year) and long-term (the due date is more than a year away).
Your current liabilities may include:
- Accounts payable (items you bought on credit)
- Wages for employees for the hours they have worked
- Loans that need to be paid back within a year
- Any taxes owed
And here are some (non-current) long-term debts:
- Loans that you don’t have to pay back within a year
- Bonds your company has issued
For our fictional chocolatiers, their liabilities may look like:
- Accounts Payable: $75
- Long-term Debt: $1,000
- Total Liabilities: $1,075
Shareholder’s Equity/Owner’s Equity
Equity refers to monies currently held by a company. For sole proprietorships, the category is called “owner’s equity,” and for corporations, this is known as “stockholders’ equity.” This section displays the parts that business owners/shareholders possess.
Owners’ equity:
- Capital or the money invested into the business by the owners
- Private or public stock
- Retained earnings, i.e., all revenue minus all expenses since launch
Equity can also drop when an owner draws money out of the company to pay themself or when a corporation issues dividends to shareholders.
For our fictional chocolatiers, their equity may look like:
- Capital: $2,500
- Retained Earnings: $5,450
- Drawings: $-4,500
- Total Equity: $3,450
What Is the Balance Sheet Equation?
The balance sheet depicts the company’s total assets through either debt or equity. The balance sheet is based on the basic equation: Assets = Liabilities + Equity.
In other words, the assets listed and the liabilities plus equity must balance. For our chocolatier, it would look like so:
$4,525 = $1,075 + $3,450
Vertical Analysis
Another way to examine the balance sheet report is by conducting a vertical analysis of the balance sheet. Vertical analysis is a method of looking at the financial statement by looking at each line as a percentage of some predetermined base figure from the statement.
For example, the vertical analysis can look at a particular line item on the balance sheet as a percentage of total assets.
Classified Balance Sheet
In addition to a vertical analysis, another way to parse your balance sheet is with a classified balance sheet. A classified balance sheet is a breakdown of each of your balance sheet’s subcategories, creating a more nuanced and valuable report. There are no specific or standardized groupings of subcategories. Instead, your financial management team can decide what classifications are best to use for your short-term and long-term goals.
Next Steps: Building Your Balance Sheet With Datarails
To take balance sheet reporting up a notch, cloud FP&A software solutions such as Datarails can assist with creating automated financial reports. And the best part? You don’t have to change the way you work to improve your processes.
Datarails is an Excel-based solution, which means that you can leverage your existing spreadsheets, models, and intellectual property that is built into your Excel spreadsheets. Keep using the interface you are familiar with while simultaneously boosting your capabilities. Automate your balance sheet template without changing how you work. Datarails fits itself to you, not the other way around.
>> Download a free balance sheet template and see for yourself!
>> To Learn more about balance sheet vs income statement