Click for Quick Takeaways
- Forecast accuracy is now a top CFO priority: Gartner’s 2025 survey found 51% of CFOs rank improving forecast accuracy among their top five priorities for 2026.
- The digitization gap persists: McKinsey found that while 98% of finance functions have invested in automation, only 1% have automated more than three-quarters of their forecasting processes.
- Finance leaders are shifting focus: 55% of CFOs now prioritize long-term planning over short-term firefighting, up from 30% the previous year, according to McKinsey’s latest survey.
- AI delivers measurable forecasting gains: PwC found finance teams using AI agents achieved up to 40% improvement in accuracy and speed, while Gartner predicts 90% adoption by 2026.
- The maturity divide is widening: AFP’s 2025 survey shows high-maturity treasury departments automate over half their forecasting processes, while 58% of CFOs increase focus on cash forecasting amid volatility.
Financial forecasting was once a periodic planning exercise. Now, of course, it’s a continuous decision system that sits right at the heart of company strategy.
Finance teams can no longer rely on static annual budgets or quarterly forecasts. Market shifts, cost volatility, revenue uncertainty, and liquidity pressures demand rolling, data-driven financial forecasting that updates as reality changes.
Gartner’s 2024 CFO survey revealed that 79% of CFOs stated that leading digital transformation efforts is their top area of focus. This transformation extends to financial planning tools and processes, where traditional Excel-based CVP models are being augmented with integrated budgeting and forecasting platforms. These modern solutions eliminate the manual work of copying, formatting, and pasting data while automatically updating analyses as underlying financial data changes. The shift toward digital FP&A tools reflects CFOs’ recognition that manual processes create inefficiencies and increase the risk of errors, particularly when dealing with complex multi-product scenarios or rapidly changing market conditions.But here’s the problem: most organizations still forecast the future using outdated tools and backward-looking processes:
- Forecasts are built manually in spreadsheets
- Data is fragmented across ERP, CRM, HR, and operational systems
- Forecast updates lag behind real business changes
- Scenarios are difficult and time-consuming to model
- Variance analysis happens after decisions have been made
All this leaves finance leaders struggling to answer fundamental questions about their businesses:
- Where are we actually headed this quarter and this year?
- Which assumptions matter most?
- What happens if revenue, costs, or cash shift unexpectedly?
- How confident are we in our forecast?
Enter modern financial forecasting, replacing static plans with continuous, connected, and scenario-aware models.
Leading FP&A platforms enable finance teams to move from manual forecasting to live, AI-powered predictive analytics, combining:
- Automated data consolidation
- Rolling forecasts
- Scenario modeling
- Variance explanations
- Forecast accuracy improvements
This article explains how you can get there.
What Is Financial Forecasting?
Financial forecasting is the process of predicting a company’s financial performance by analyzing historical data, current trends, and assumptions about future conditions, revenue, costs, and profits.
For example, a forecast might estimate next quarter’s revenue based on last year’s sales growth rate, adjusted for current market conditions.
The process typically results in forecasted financial statements. These are essentially pro forma versions of the income statement, balance sheet, and cash flow statement that reflect expected results.
It’s important to note the difference between forecasting and other financial planning activities like budgeting and strategic planning.
While a budget is a goal or plan, a forecast is an informed projection of likely outcomes. Forecasts tend to be updated more frequently (monthly or quarterly), whereas budgets might be updated annually.
When it comes to strategic vs. operational forecasting, financial forecasts can also vary in scope and purpose.
Strategic forecasts focus on long-term goals, often taking the form of three-to-five-year plans for growth, investments, or market expansion.
Operational forecasts are short-term outlooks, covering data like monthly cash flow or quarterly sales in order to manage daily business needs.
Finance teams typically use both: strategic for direction, operational for execution.
Financial Forecasting vs. Financial Modeling
It’s easy to confuse financial forecasting with financial modeling, since they’re closely related.
However, forecasting is about predicting financial outcomes, while modeling is about building the mathematical representations used to make those predictions.
A financial model is typically a spreadsheet or software-based tool that takes inputs including assumptions, drivers, and historical data to calculate expected financial results.
Financial modeling can be broader than just forecasting: models are also used for valuation, scenario analysis, and evaluating specific projects, such as, building a model to see how acquiring another company might affect your financials.
Meanwhile, forecasting is specifically about estimating future financial performance, often using models as a tool.
For a deeper dive into financial modeling techniques and best practices, check out our financial modeling guide. It covers how finance teams build models and the tools they use.
Benefits of Financial Forecasting
Financial forecasting, especially using modern principles and practices, can be a powerful tool for businesses and finance teams.
Here are some of the key advantages:
- More informed decision-making
- More effective resource allocation and budgeting
- Better risk management and agility
- Performance monitoring and accountability
- Higher investor and stakeholder confidence
By reaping these benefits, companies turn financial forecasting from a mundane reporting exercise into a strategic asset.
Challenges of Financial Forecasting
As important as financial forecasting is, it can be challenging in practice.
According to Gartner’s 2025 survey of over 200 CFOs, 51% rank improving financial forecast accuracy and quality among their top five priorities for 2026. This focus on accuracy reflects the real costs of getting forecasts wrong. Finance leaders know that missed projections trigger cascading problems: unexpected cash shortages, misallocated resources, and damaged stakeholder confidence. The challenge intensifies in volatile environments where traditional forecasting methods struggle to keep pace with rapid market shifts.
Here are some of the highest hurdles finance professionals come up against when trying to produce reliable forecasts:
- Data quality and integration
- Manual processes and spreadsheet errors
- Uncertain assumptions
- Volatility and external factors
- Lack of time for analysis
These challenges aren’t random obstacles: they’re symptoms of deeper structural problems with how most organizations approach forecasting. To understand why these pain points persist, we need to examine the fundamental limitations of traditional forecasting methods.
Why Traditional Financial Forecasting Fails
Many companies today still rely on forecasting practices that were fine when the world didn’t move so fast, but are now outdated and, frankly, inadequate. Here’s why.
Static Models in a Dynamic World
Annual forecasts can become irrelevant when circumstances change rapidly, whether due to internal factors, external events, or a combination of both. Relying on static, straight-line projections can lead to poor decisions when reality shifts. Dynamic conditions require dynamic forecasting that updates regularly.
Spreadsheet Dependency
Excel-based forecasts often contain errors, competing versions, and fragile links that break as businesses grow. Manual updates across complex spreadsheets waste time and create risk. In turn, finance teams end up fixing models instead of analyzing performance.
McKinsey’s 2024 CFO Pulse Survey found that while 98% of finance functions have invested in digitization and automation, only 1% have automated more than three-quarters of their processes. A plurality of CFOs report that just one-quarter or less of their processes are currently digitized. The roadblocks are largely organizational: 70% cite demanding workloads as a barrier to technology adoption, 67% point to capability gaps, and 62% report insufficient resources. When finance teams spend their time compiling data rather than analyzing it, forecast quality inevitably suffers.
Disconnected Data
Traditional forecasting manually pulls disconnected data from multiple systems, leading to inconsistencies and delays. Without real-time integration, forecasts don’t reflect current business conditions. Data silos create fragmented, unreliable forecasts.
Slow Forecast Cycles
Manual processes and scattered data make traditional forecasting slow. Forecasts may be outdated even before they’re reviewed, reducing their usefulness for timely decisions.
Limited Scenario Planning
Legacy forecasting methods make scenario modeling difficult , so teams often skip it or perform only minimal analysis. This leaves companies unprepared for unexpected changes. Without flexible models, businesses struggle to adapt under pressure.
Collectively, these issues explain why so many finance leaders have been frustrated with forecasting. They build forecasts that quickly diverge from reality, contain unknown errors, or fail to answer the “what ifs” that keep executives up at night.
Finance leaders are shifting their focus from short-term firefighting to strategic planning and long-term resource allocation. McKinsey’s latest CFO survey reveals that 55% of CFOs now cite long-term planning as a top priority, up dramatically from 30% the previous year. Similarly, 60% identify strategic planning as a priority, compared to just 38% in 2023. This represents a fundamental reorientation for finance functions. Rather than reacting to immediate pressures, CFOs are building forecasting capabilities that support multi-year planning horizons. This transition requires moving beyond spreadsheet-based models toward platforms that can handle the complexity of integrated, rolling forecasts.
But before exploring solutions, it’s worth establishing what finance teams actually forecast. Understanding the full scope, from revenue projections to cash flow to integrated statements, clarifies why traditional methods fall short and what modern forecasting needs to address.
Types of Financial Forecasting
Finance teams produce several core forecasts, each addressing a different aspect of business performance. While terminology varies across organizations, most forecasts fall into these categories:
Revenue/Sales Forecasts
Revenue forecasts predict future sales volumes and resulting income. This typically serves as the foundation for other financial projections, since revenue assumptions shape working capital needs, hiring plans, and cash flow timing.
Sales forecasts can be built using historical growth rates, sales pipeline data, customer renewal patterns, or market indicators depending on the business model. For a SaaS company, this might mean forecasting monthly recurring revenue by cohort. For a manufacturer, it could mean forecasting units sold by product line and geography.
Operating Expense Forecasts
Expense forecasts project costs across major categories: personnel, facilities, marketing, technology, and general overhead. These forecasts often split between fixed costs (rent, base salaries) and variable costs tied to revenue or activity levels.
Headcount and payroll represent a critical subset of expense forecasting. Personnel models forecast staffing levels and associated costs by department, accounting for planned hiring, attrition, raises, and benefits. Since labor typically represents 60-70% of operating expenses for many businesses, getting headcount forecasts right is essential to overall accuracy.
Cash Flow Forecasts
Cash flow forecasts track the timing of actual cash movements: when money hits the bank account versus when revenue is recognized or expenses are incurred. These forecasts account for:
- Collection timing on receivables
- Payment timing on payables
- Capital expenditures
- Debt service and financing activity
- Working capital changes
The output is a forward view of net cash position, often shown weekly for the next 13 weeks and monthly beyond that. This forecast answers the critical question: “Will we have enough cash, and when?”
For more on this topic, see our guide to Cash Flow Forecasting.
Full P&L (Income Statement) Forecasts
A complete income forecast projects the entire income statement from revenue through net income. This combines revenue and expense forecasts with other line items: cost of goods sold, gross margin, depreciation, interest expense, and taxes.
The result is a comprehensive view of profitability over time. Most organizations build monthly P&L forecasts for the next 12-18 months, with quarterly or annual views extending further.
Balance Sheet and Three-Statement Forecasts
More sophisticated forecasts integrate all three financial statements: income statement, balance sheet, and cash flow statement. Changes in one statement automatically flow through to the others, reflecting how revenue growth affects working capital, how capital spending impacts depreciation, and how financing decisions affect interest expense.
Integrated three-statement models are essential for understanding the full financial impact of strategic decisions, but they require more effort to build and maintain.
In practice, most finance teams maintain separate models for each forecast type, then consolidate them into a master financial model or planning platform. The key is ensuring consistency across forecasts: your expense forecast should align with the operating expenses in your P&L forecast, and your P&L should reconcile to your cash flow forecast after adjusting for timing differences.
Next you’ll discover a step-by-step process toward better financial forecasting.
The Financial Forecasting Process Explained Step-by-Step
A robust financial forecasting process typically follows a series of steps to ensure the output is thorough and reliable.
While every organization might have its own spin on the process, the following steps represent a solid blueprint:
Step 1: Define the Forecast Objectives and Horizon
Clarify what you’re forecasting and over what time period: short-term operations or long-term strategy? Decide whether to forecast full financial statements or specific metrics like cash flow.
Align the forecast with budgeting and planning cycles to ensure relevance.
Step 2: Gather Historical Data and Inputs
Collect recent financials and operational data to use as a baseline. Include past forecasts for comparison and gather key inputs from stakeholders. This ensures your assumptions are informed, and the forecast reflects actual business plans.
Step 3: Choose Your Forecasting Methodology
Pick methods that suit each part of the forecast: trend analysis, driver-based models, top-down or bottom-up approaches. Match methodology to the type of data available and the business context. Use consistent models and templates for clarity.
Step 4: Build the Forecast Model
Create the forecast in your preferred tool, often resulting in pro forma income, cash flow, and balance sheet statements. Make sure the three statements connect logically. Refine assumptions to ensure the model is realistic and aligned with goals.
Step 5: Review and Validate
Check for errors, unrealistic figures, and misaligned assumptions. Get feedback from department leads and compare forecasted results to historical data. Use sensitivity analysis to test the impact of key assumptions.
Step 6: Scenario Modeling (if applicable)
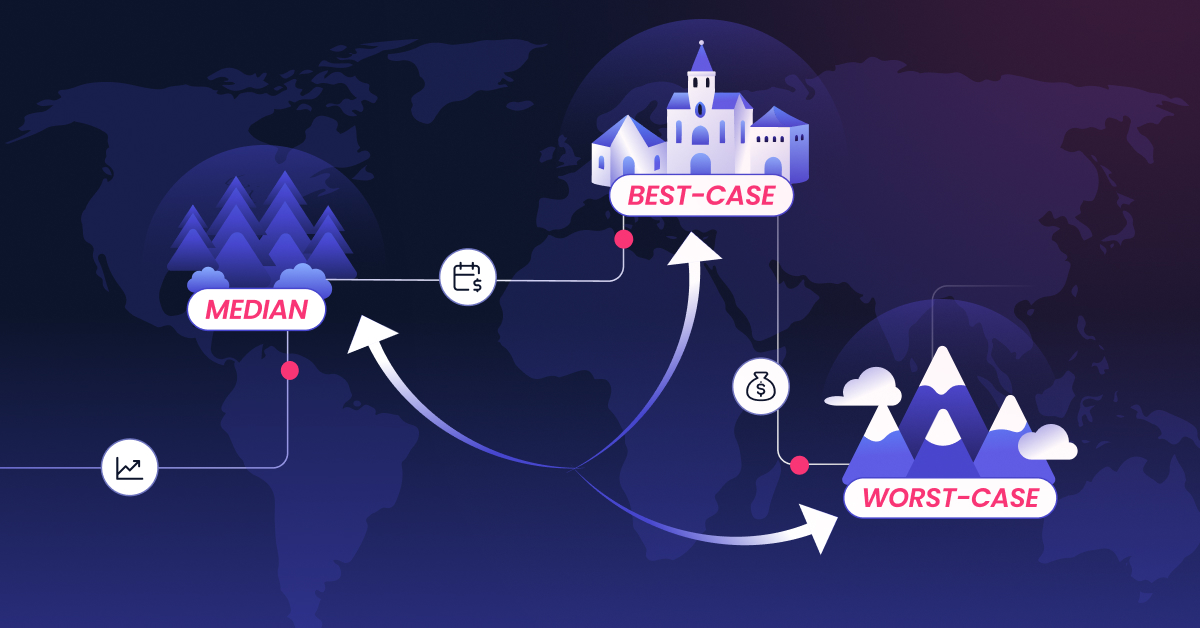
Build multiple versions of the forecast to reflect base, upside, and downside scenarios. Adjust assumptions to reflect different risks or opportunities. This prepares the business for a range of possible outcomes.
Step 7: Present and Communicate
Summarize the forecast clearly in reports or dashboards, focusing on key drivers, results, and action points. Tailor the message for stakeholders and explain the story behind the numbers. Clarify how the forecast will be used and updated.
Step 8: Monitor and Update Continuously
Track performance against the forecast and update it regularly, monthly or quarterly, depending on business needs. Include variance analysis to learn from deviations. Treat forecasting as an ongoing process, not an occasional event.
By following these steps, financial forecasting becomes a disciplined practice that yields meaningful and actionable data. It moves finance teams away from reactive scrambling to a proactive planning cycle.
Of course, applying the right methods is also crucial, which brings us to common forecasting methods used in finance.
5 Common Financial Forecasting Methods
Once you know what to forecast, the next question is how. Finance teams use several forecasting methods, often combining multiple approaches depending on the data available and the nature of the business. Here are the most common methods:
Historical Trend Analysis
This method projects future performance by analyzing patterns in historical data. You might calculate average growth rates over the past few years and apply them forward, or use more sophisticated statistical techniques like regression analysis to identify trends.
When to use it: Historical trend analysis works well for stable, mature businesses with predictable patterns. It’s less useful in high-growth companies or volatile environments where past performance doesn’t reliably predict the future.
Pros: Simple, objective, and easy to explain. Requires minimal subjective judgment.
Cons: Assumes the future will resemble the past. Misses inflection points, market shifts, or strategic changes that break historical patterns.
Driver-Based Forecasting
Driver-based forecasting builds projections from underlying business drivers rather than line items. Instead of forecasting “total revenue,” you forecast the drivers that create revenue: number of customers, average order value, conversion rates, churn rates, etc. Revenue becomes a calculated output of these inputs.
The same logic applies to expenses. Rather than forecasting “travel expense,” you forecast headcount by department, average trips per employee, and cost per trip. The expense line becomes a formula.
When to use it: Driver-based forecasting excels when you understand the operational levers that drive financial outcomes. It’s particularly powerful for businesses with clear unit economics: SaaS, subscription models, e-commerce, manufacturing.
Pros: Creates transparency around assumptions. Makes it easy to model scenarios by changing key drivers. Connects operational plans directly to financial outcomes.
Cons: Requires identifying the right drivers and gathering reliable data on each. Can become complex with too many drivers.
Rolling Forecasts
Rolling forecasts continuously project forward a fixed time period, typically 12-18 months, regardless of the fiscal year. Each month or quarter, you add a new period to the forecast and drop the oldest one, always maintaining the same forward horizon.
This contrasts with traditional forecasting, where you forecast to December 31st and start over each January.
When to use it: Rolling forecasts suit any organization operating in dynamic conditions where annual forecasts become stale quickly. They’re especially valuable when leadership needs continuous visibility beyond the current fiscal year.
Pros: Always maintains forward visibility. Reduces the “hockey stick” effect where teams push performance into future periods. Encourages continuous planning rather than annual events.
Cons: Requires more frequent updates and organizational discipline. Can be harder to integrate with annual budget cycles.
We cover implementing Rolling forecasts in detail in a separate guide.
Zero-Based Forecasting
Zero-based forecasting builds each line item from scratch rather than starting with last year’s actuals and adjusting. You justify every dollar of expense or revenue based on current business needs and plans, not historical precedent.
When to use it: Zero-based forecasting works well during major business changes, such as restructuring, cost transformation, pivots, or turnarounds, when past spending patterns shouldn’t dictate future ones.
Pros: Forces discipline and justification for every assumption. Eliminates “budgetary slack” where teams pad forecasts. Can uncover inefficiencies hidden in incremental approaches.
Cons: Extremely time-consuming. Requires significant input from department leaders. May create political friction when challenging existing allocations.
Top-Down vs. Bottom-Up Forecasting
This isn’t a distinct method but rather a dimension of how forecasts are built:
Top-down forecasting starts with high-level targets set by leadership, often based on market expectations, board commitments, or strategic goals, then allocates those targets down to business units or departments.
Bottom-up forecasting starts with detailed inputs from individual departments, products, or teams, which are then aggregated upward into company-wide forecasts.
In practice, most organizations use a hybrid approach: leadership sets overall parameters or guardrails (top-down), then departments build detailed plans within those boundaries (bottom-up), followed by iteration between the two until alignment is reached.
Each method has its place, and they’re not mutually exclusive. You might use driver-based models for revenue, historical trends for certain stable expense categories, and maintain everything on a rolling forecast timeline. The key is choosing methods that match your business model, data availability, and the decisions the forecast needs to support.
For deeper exploration of when and how to apply each method, see our dedicated article on Financial Forecasting Methods.
Rolling Forecasts vs. Traditional Forecasting: Making the Shift
One of the most significant changes in modern FP&A is the shift from static, annual forecasting to continuous, rolling forecasts. While we covered rolling forecasts as a methodology above, it’s worth examining why this approach increasingly outperforms traditional forecasting and what the transition requires.
How Traditional Forecasting Works
Traditional forecasting typically follows the fiscal calendar. In Q4, finance teams build a forecast for the upcoming year:the “budget” or “annual plan.” This forecast projects revenue, expenses, and cash flow month by month through December 31st.
Once approved, the forecast becomes relatively static. It might be revised once or twice during the year (often mid-year reforecasts), but many organizations treat the original budget as the baseline for performance measurement throughout the year.
By June, you’re measuring performance against assumptions made six months ago. By November, you’re comparing actuals to forecasts built nearly a year earlier while having zero visibility into the following fiscal year.
How Rolling Forecasts Work
Rolling forecasts maintain a constant forward horizon, typically 12-18 months, regardless of the fiscal year. Each month or quarter, the forecast is updated:
- Actual results replace forecasted results for completed periods
- A new period is added to the end
- All forward periods are refreshed based on current information
If you’re using a 12-month rolling forecast and update monthly, you always have visibility 12 months forward. In March, you’re forecasting through next March. In June, you’re forecasting through next June.
The forecast “rolls” forward continuously, never tied to December 31st or any fixed endpoint.
Why Rolling Forecasts Outperform Static Plans
Continuous Relevance: Rolling forecasts never become stale. By definition, they always reflect recent performance and current assumptions rather than year-old predictions.
Better Resource Decisions: When you can see 18 months forward year-round, you make better hiring, capital, and investment decisions. Traditional forecasts create blind spots where leadership can’t evaluate opportunities beyond the current fiscal year.
Reduced Gaming: Static annual budgets encourage sandbagging and end-of-year spending surges. Rolling forecasts reduce these behaviors because there’s no “finish line” to game.
Faster Response: When market conditions shift, rolling forecasts adapt within weeks. Traditional reforecasting processes can take months to execute and approve.
Cultural Shift: Rolling forecasts encourage continuous planning rather than annual events. Finance becomes an ongoing business partner rather than the team that “does the budget” once a year.
The Challenges of Rolling Forecasts
Rolling forecasts aren’t without challenges:
More Frequent Updates: Rolling forecasts require discipline. If your organization struggles to update forecasts monthly, rolling forecasts won’t solve that. They’ll just expose the problem more visibly.
Change Management: Transitioning from annual budgets to rolling forecasts requires organizational buy-in. Department leaders accustomed to annual planning cycles need to adapt to continuous forecasting rhythms.
Integration with Budgets: Many organizations face external requirements for annual budgets: board approvals, loan covenants, compensation plans tied to annual targets. Rolling forecasts can coexist with annual budgets, but the relationship needs to be clearly defined.
Tool Requirements: Manual spreadsheet-based rolling forecasts quickly become unwieldy. Most organizations implementing rolling forecasts benefit from FP&A platforms designed to support continuous planning.
When to Transition to Rolling Forecasts
Consider moving to rolling forecasts when:
- Your annual forecast is consistently obsolete by Q2
- Leadership regularly asks “what happens next year?” but you have no visibility beyond December
- You operate in a volatile industry where conditions change faster than annual planning cycles
- You’re experiencing rapid growth or transformation where static plans can’t keep pace
- Your organization is mature enough to handle continuous planning discipline
The transition doesn’t have to be all-or-nothing. Many organizations start with rolling cash flow forecasts (where accuracy matters most) before expanding to full P&L and headcount forecasts.
Hybrid Approaches
Some organizations maintain both: an annual budget for governance and accountability, with rolling forecasts for operational planning and decision-making. The budget might be approved once yearly and used for performance measurement, while rolling forecasts guide resource allocation and strategic decisions.
This hybrid approach can ease the transition and satisfy stakeholders who prefer annual cycles while still providing the benefits of continuous forecasting.
For more detailed guidance on implementing rolling forecasts, including templates and best practices, see our comprehensive Rolling Forecast Guide.
We’ve now covered what finance teams forecast, the methodologies they use, and the shift to continuous planning through rolling forecasts. These improvements address many traditional forecasting failures, but they still require significant manual effort, careful assumption-setting, and ongoing human judgment. The next evolution comes from artificial intelligence, which is transforming not just when and how we forecast, but the accuracy and efficiency of the entire process.
How AI Is Changing Financial Forecasting
AI-powered forecasting tools are delivering measurable improvements in both speed and accuracy.
PwC’s AI Agent Survey found that finance teams deploying AI agents achieved up to 40% improvement in forecasting accuracy and speed. The impact extends beyond pure prediction: Gartner predicts that 90% of finance functions will deploy at least one AI-enabled technology solution by 2026, with forecasting among the most common applications.
These tools automate variance analysis, identify anomalies in real time, and generate scenario recommendations that would take human analysts days to produce.
Early adopters report that AI has fundamentally changed how their teams spend time, shifting effort from data compilation to strategic interpretation.
Here are some key ways AI is transforming the process:
- Finding patterns in large datasets that humans might miss, improving forecast accuracy.
- Ingesting real-time data to instantly update forecasts.
- Rapidly modeling thousands of scenarios, highlighting the most likely or risky ones.
- Instantly analyzing variances between forecast and actuals, pinpointing key drivers.
- Generating plain-language summaries of forecasts, saving time and improving communication.
- Handling repetitive forecasting tasks, letting finance focus on strategy and decision-making.
Financial Forecasting Tools: What to Look For
Given the importance and complexity of forecasting, many organizations turn to dedicated financial forecasting tools and software.
When doing so, prioritize these features in your chosen solution:
- Automated data consolidation
- Real-time updates and collaboration
- Scenario modeling and what-if analysis
- Rolling forecast and calendar flexibility
- Driver-based and AI-enhanced modeling
- Auditability and transparency
- Integration with broader FP&A (Planning & Analysis)
Our roundup of the best financial forecasting software goes into detail on various tools and what they offer.
How Financial Forecasting Fits Into FP&A
Financial forecasting doesn’t exist in a vacuum: it’s a core component of the broader Financial Planning & Analysis (FP&A) function.
Here’s how forecasting fits into and enhances various FP&A activities:
Monthly/Quarterly Close and Reporting: forecasting is often part of the close process, with updated projections shared alongside actuals.
Budgeting and Forecasting Process: budgets and forecasts should be connected, with the budget acting as the first forecast of the year.
Performance Management and KPIs: forecasts help monitor whetherKPIs will be met, prompting corrective actions when targets are at risk.
Board Reporting and Strategic Planning: boards rely on forecasts to evaluate if strategic goals are on track, often using scenario forecasts to assess risks and opportunities.
Cash Management and Treasury: Treasury teams use forecasts to manage cash, plan borrowing, and make investment decisions.
Operational Decision Support: Forecasting supports cross-functional decisions, from promotions to hiring to capital projects.
The Future of Financial Forecasting
Forecasting won’t stop at finance: it will expand to include sales, marketing, operations, HR, and supply chain management in unified models. Changes in one area will automatically update related forecasts.
This integrated planning will break down silos and improve organizational alignment.
With AI and analytics, stakeholders will also demand more accurate forecasts. Tools will continuously refine models and measure forecast accuracy.
Forecasting will also become more scientific, with frequent updates and back-testing to reduce uncertainty.
The automation gap between leading and lagging organizations is stark and growing. AFP’s 2025 Treasury Benchmarking Survey found that treasury departments at the highest maturity level employ automation for over half of their liquidity forecasting processes, significantly outpacing less mature departments.
Meanwhile, PwC reports that 58% of CFOs are increasing their focus on cash and liquidity forecasting to navigate today’s volatile environment.
Organizations that fail to modernize their forecasting infrastructure face a compounding disadvantage: manual processes limit forecast frequency, reduce scenario flexibility, and prevent the real-time visibility that competitive decision-making requires.
The future belongs to finance teams that treat forecasting as a continuous, technology-enabled discipline rather than a periodic planning exercise.
In short, there’s a lot to look forward to, and changes will happen fast.
Why Datarails Is Built for Modern Financial Forecasting
Moving from manual, static forecasting to a continuous, data-driven approach is crucial.
Datarails is built for exactly this financial forecasting paradigm, addressing the challenges of traditional forecasting while empowering finance teams to leverage the tools of the future, all without leaving behind the familiarity of Excel.
Datarails is built for modern FP&A with a focus on forecasting:
- Automating data consolidation (overcoming data fragmentation)
- Maintaining Excel flexibility (meeting user adoption and complex modeling needs)
- Adding real-time capabilities (surpassing static/outdated forecasts)
- Providing scenario and rolling features (replacing static planning)
- Incorporating AI and audit trails (minimizing errors and insight gaps)
If you’re a finance leader looking to bring your forecasting into the 21st century, to predict, adapt, and ultimately win, Datarails is a platform designed with that mission in mind.
Financial Forecasting FAQs
Financial forecasting is the process of predicting an organization’s financial performance by analyzing historical data, market trends, and other relevant factors.
Financial forecasting supports strategic planning, risk management, budgeting, and investor attraction.
Financial forecasting methods include historical trend analysis, driver-based forecasting, rolling forecasts, zero-based forecasting and top-down or bottom-up forecasting.
Budgeting is a detailed plan that outlines a business’s expected revenues and expenses for a specific period. Conversely, financial forecasting estimates the actual financial outcomes (such as revenue or income) that the company is likely to achieve in that period.
It’s common for finance teams to rely on spreadsheet software such as Microsoft Excel or Google Sheets for financial forecasting.
As businesses grow, they often switch to dedicated financial forecasting software or planning platforms.
Financial forecasts should be updated regularly to ensure accuracy and relevance. There isn’t a one-size-fits-all rule. That said, many companies revise their forecasts monthly, quarterly, or annually to reflect the latest market conditions and business data.
AI improves financial forecasting by using machine learning algorithms to analyze large datasets and identify patterns or trends that traditional methods might miss.