Table of Contents:
What is ad-hoc reporting?
Ad hoc reporting vs. structured reporting – what’s the difference?
How to Create Ad hoc reports in Excel
1) Start With Raw Data
2) Understand The Request
3) Filtering Data And Its Limitations
4) Data Links And Queries
Ad Hoc Reports in Excel — Using Pivot Tables
Presenting Data With Tables and Graphs
Why produce ad-hoc reports?
Things to keep in mind when producing an ad-hoc report
Issues with ad-hoc reporting
Common ad-hoc reporting tools
Using Datarails To Respond To Ad-Hoc Request
Ad hoc reporting in Excel can take on many forms. One of the benefits of using a spreadsheet-based software application is that it is relatively flexible in how it can be used. Presenting data in Excel can range from simple to complex, and as a result, it is often the best way to quickly field ad hoc requests from various departments.
Before we get into the details and best practices of ad hoc reporting specifically in Excel, let’s go over the basics of ad hoc reporting.
What is ad-hoc reporting?
Ad-hoc reporting refers to a process that is designed to answer a single, specific business question. Users can create a report that does not already exist or choose to drill deeper into a static report to get details about accounts, transactions, or records.
Ad-hoc reports are financial reports created for one-time use. Today’s volumes of data and modern tools make it possible for employees to analyze data on an as-needed basis to answer specific business questions. Instead of waiting for scheduled reports, this allows business queries to be answered on-the-spot.
Sometimes specific business questions need to be answered quickly. With ad-hoc analysis, decision-makers obtain insights more rapidly, allowing them to make decisions flexibly and with as accurate information as possible.
Ad hoc reporting vs. structured reporting – what’s the difference?
Structured reports tend to use a formalized reporting template. Ad hoc reports, on the other hand, are generated on a needs-basis, so they tend to differ in their shape and subject matter.
Structured reports, also known as static reports, tend to be more formatted and are distributed to a larger audience. They are typically used to keep stakeholders informed on a regular basis regarding certain parameters.
Ad-hoc analyses on the other hand are produced once and are shared with a smaller audience in order to address a specific pain point or question. Are sales lower than usual? Why did we overspend this month? These are examples of time-specific questions that may arise and can be answered using ad-hoc reports. Using Excel, or other spreadsheet programs, for ad hoc reports has a lot of benefits and some downsides.
How to Create Ad hoc reports in Excel
1) Start With Raw Data
In order to respond to any request, you first need data. Almost any system will export to Excel these days or .csv file format. Using these spreadsheet exports will save time and energy.
Always be sure to create a tab labeled “raw data” that you do not manipulate. This will allow you to link back to it or quickly reference the raw data for quality checks later on.
Maintaining the integrity of raw data is important when fielding requests, and sometimes it is wise to password protect the raw data tab to prevent unwanted changes. It might be the case that a request will require the use of several different data tables. In this case, combining the data tables might present difficulties.
If it is at all possible, combine like data sets. This will create the maximum benefit when utilizing features like filters and pivots.
2) Understand The Request
If the request is too ambiguous, responding using Excel can be difficult. This is because Excel will only do what it is told.
The output in Excel is dependent upon the demands that are made. This means that, if the request is unclear, time can be wasted pulling irrelevant data into the workbook and can inundate the end-user with more than what is required.
At the basis of any good response to an ad hoc request is a clear request. For example, sales demographics, financial performance, and picking times are all somewhat vague and generic requests.
Clarifying the requests might yield responses that are more useful. For example, average zip code of shoppers on a certain date, gross sales over the past month, time to pick and ship a certain product, and more.
The more clear the requests are, the more an answer will be relevant and concise.
3) Filtering Data And Its Limitations
Most requests will be for some level of information that requires the use of filtering. Filtering is a basic function in Excel and is easy to do. Columns can be sorted and filtered, and even advanced filtering is available.
Filtering is a basic approach in handling data sets when an ad hoc request is specific and somewhat easy to deal with. For instance, a request might come in for the price of a product, and a table of data might exist with all product pricing. Simply filtering by the name of the product might yield the required response.
More advanced filtering techniques exist in excel that allows users to specify a range of criteria and a range of data to apply that criteria too. This is a more complex approach to dealing with data sets when a request might be for several pieces of information.
4) Data Links And Queries
All requests, at some level, are for data. The ease at which a response can be made to an ad hoc request in Excel depends on the level of data available. Excel has the ability to link to external databases, which allows users to run custom queries that will quickly pull data into a spreadsheet.
This method of accessing data is usually the fastest and provides the most complete datasets to work with. One benefit of linking Excel to a database is that the information will be updated as the database is updated.
This allows for accurate and timely data sets to be referenced. Excel will also link to the internet to pull in various types of information; for example, market data can be linked directly to Excel and will refresh on-demand.
One drawback to accessing databases in Excel is that they often require end-users to manually refresh data, which can lead to incomplete or outdated data sets.
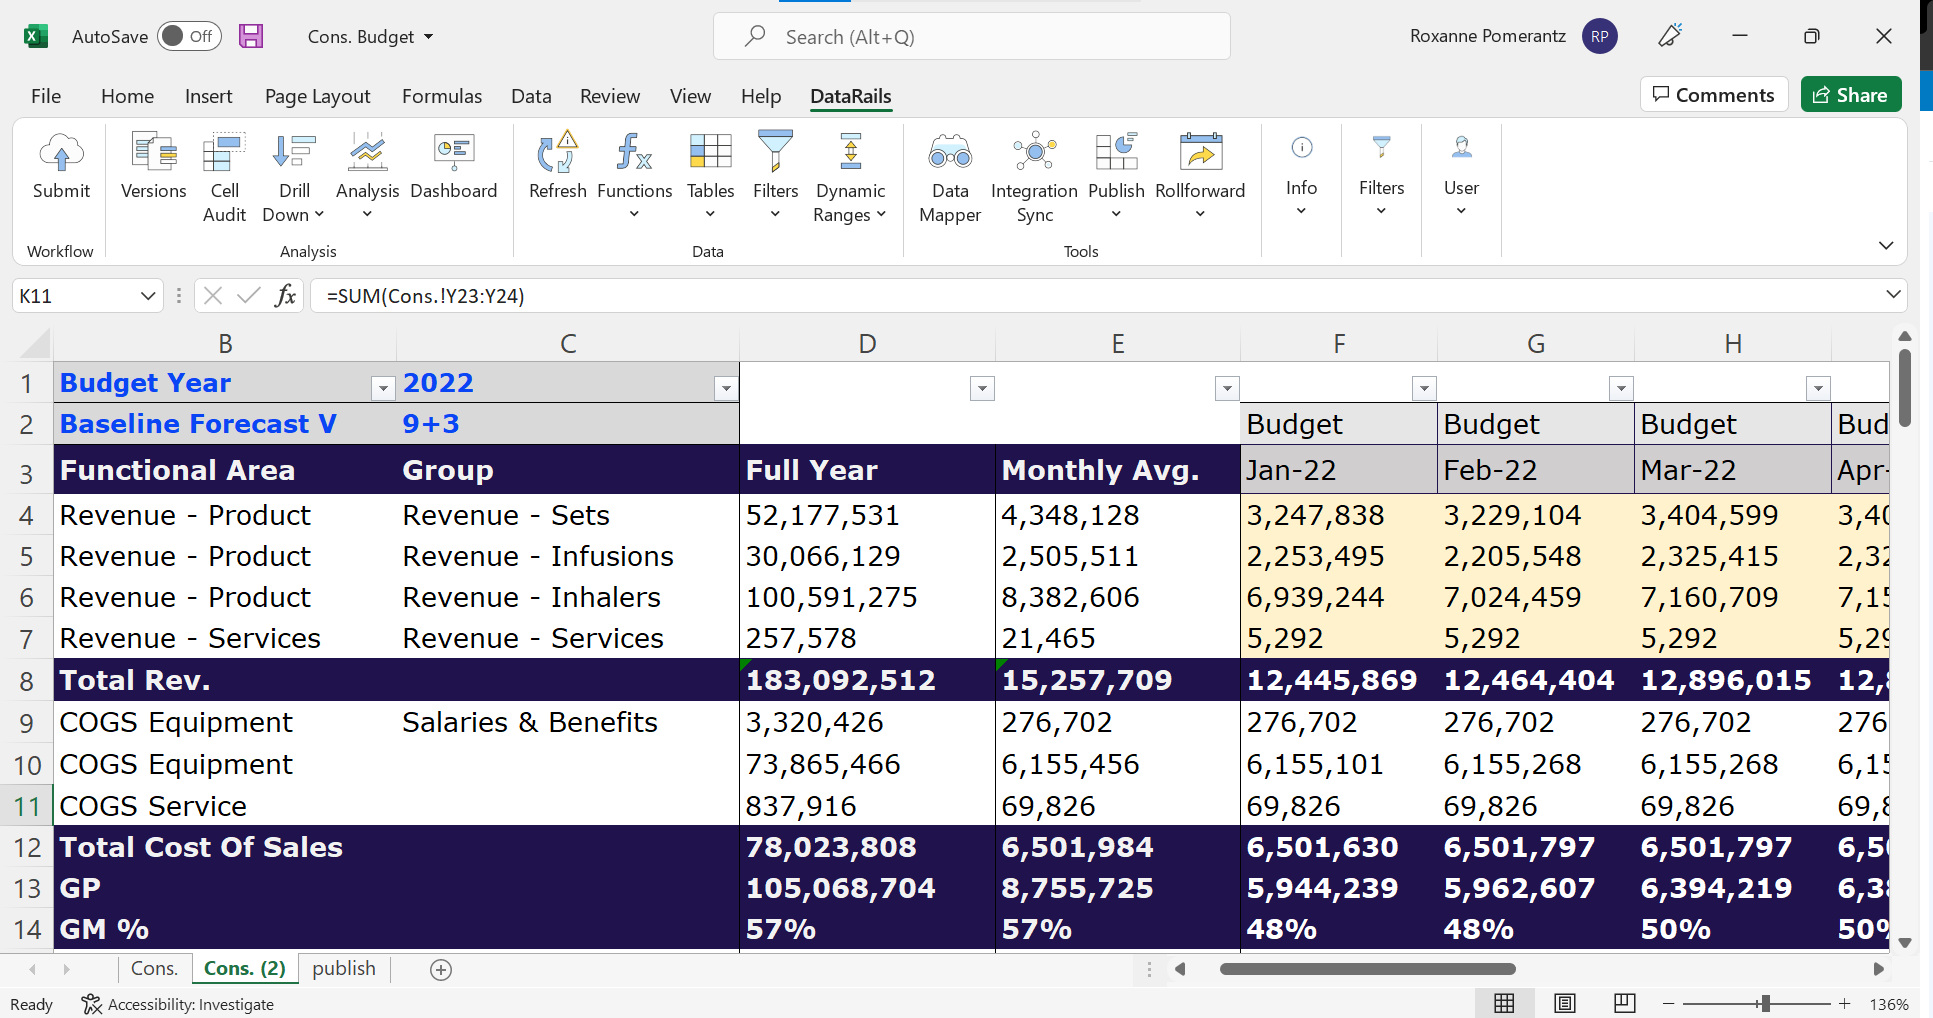
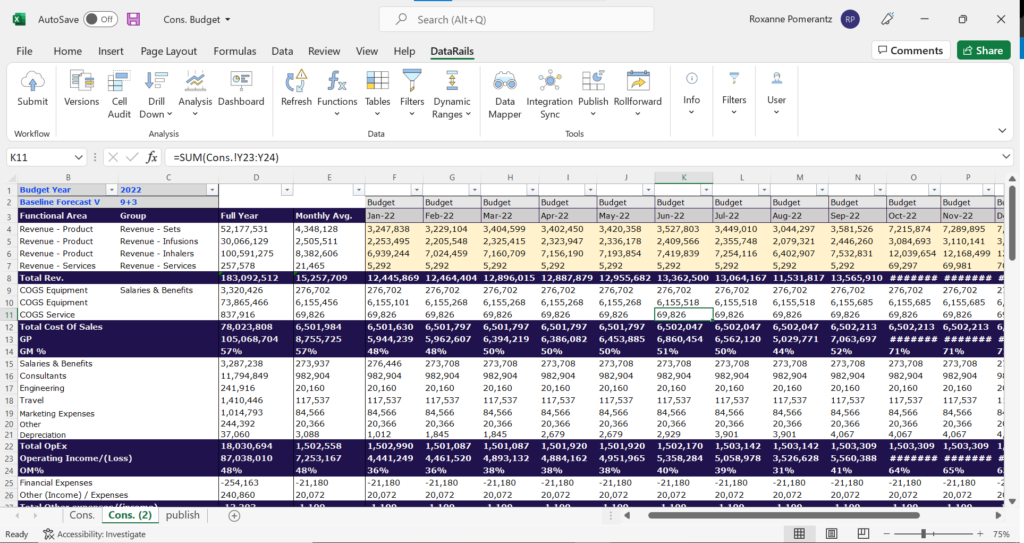
Ad Hoc Reports in Excel — Using Pivot Tables
When it comes to ad hoc reports, Excel has a feature known as pivot tables, which are a unique way to respond to ad hoc requests in Excel. They allow for data to be filtered and presented in a summarized way.
A pivot table is dynamic in that the inputs can be altered and changed depending on what the user is requesting. It will summarize all data in a given data set and will allow users to group columns and rows of data in unique ways.
Because the data is summarized, it makes using a pivot table for analytical purposes much easier. Even if the ad hoc request cannot be responded to with an actual pivot table, creating one might allow the user to more easily identify the answer to a request.
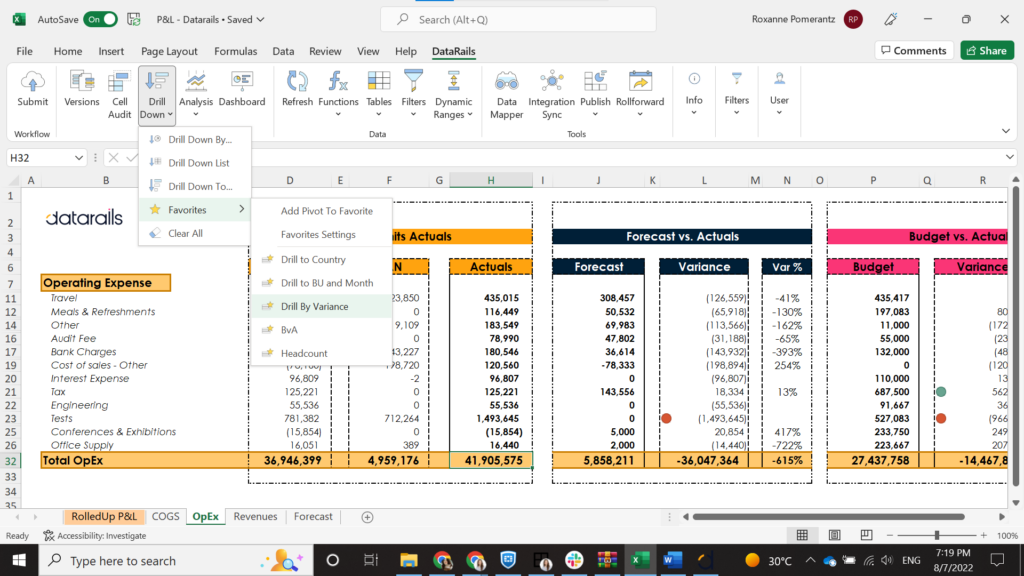
Once created, pivot tables can also “drill down” into specific data depending on what the user wants to do. This is done intuitively by simply double-clicking on the data, and because of that, pivot tables are often a default way to sort and summarize large amounts of data.
One drawback is that the data must be grouped into columns to be able to use a pivot table. Pivot tables also rely exclusively on the data sets they reference, meaning that if the data is not complete, the pivot tables’ summaries are not complete either.
Another downside is that pivot tables do not update automatically. This sometimes creates problems when data sets are linked or autonomous.
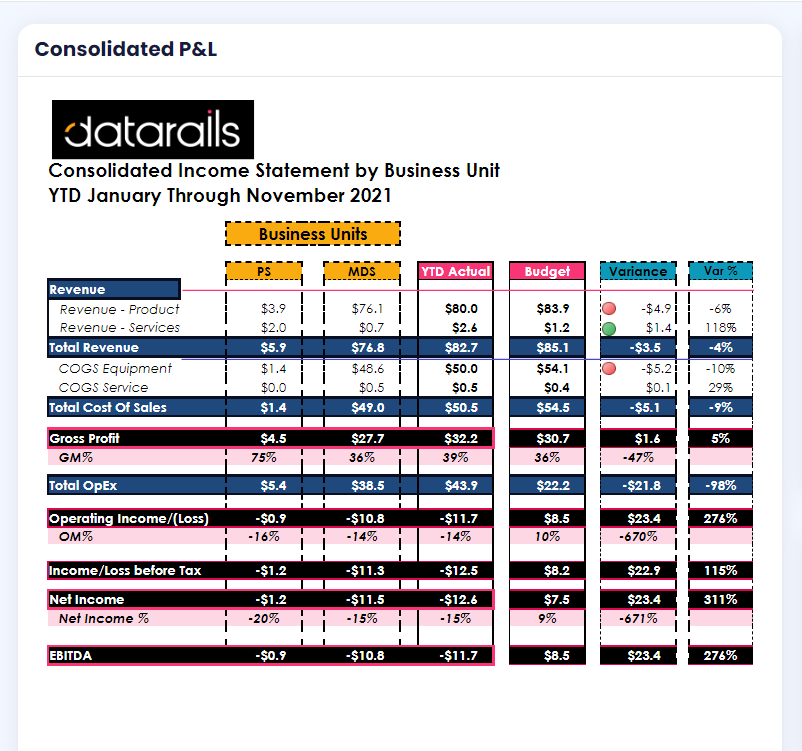
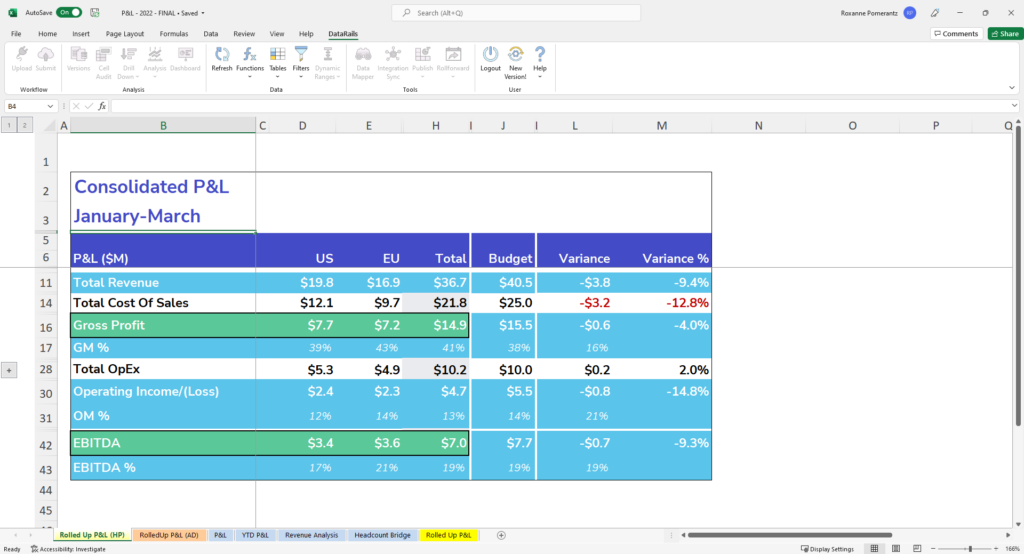
Presenting Data With Tables and Graphs
Certain ad hoc requests might require the use of tables and/or graphs. Excel has a wide variety of chart types and graphs to work with. Graphs are good at illustrating trends and directional movements with data. For example, sales volume over time, or gross revenue over time.
The challenge with responding in graphs is that there needs to be context given with the graph, and the appropriate graph needs to be selected. Line and dot graphs are good at illustrating trends, pie charts are good for illustrating proportionate data, and bar graphs are good for comparing categorical data.
Why produce ad-hoc reports?
There are a multitude of reasons to produce ad-hoc reports. However, the most common reasons tend to be:
- There’s some aspect of a regular report that needs to be further examined
- Management requests more information about a specific issue or dataset
- Some event or trigger requires looking into the numbers
Things to keep in mind when producing an ad-hoc report
1) Identify the question you’re supposed to be answering
When you’re putting together your ad-hoc report, always keep at the forefront of your mind what it is that you’re attempting to address. Knowing why you need it and how it can drive the organization forward is vital for ad hoc reporting. Each ad hoc report should ideally have at least one specific goal that you’re aiming to address.
2) Remember the acronym KISS? (Keep it simple stupid)
Set a general theme for the report so that you can design it in such a way that it doesn’t overload the reader with too many details. So, go over your report and determine what the focus is and design it in such a way that it revolves around this focus without diverging too often. If you have too many data elements in the report, it might make sense to break it up into multiple reports.
Issues with ad-hoc reporting
When producing ad-hoc reports, there are a few common issues that may arise:
1) Incomplete data
Having some — but not all — of your data in one place can serve as a limitation of ad hoc reporting. If you’re looking at siloed or partial data, reports may be insufficient as they only represent a small part of the fuller, bigger picture.
2) Lack of data governance
Data governance refers to the varying elements that are necessary to create consistency in handling organizational data. Since ad-hoc reports can be tailored to meet specific needs and interests, they may create insights that clash with other reports.
3) Data availability
For things to work, everyone needs to be using the same underlying data. If this data varies and fluctuates within one organization, you’ll see many issues arising. If different people work with different underlying datasets, what will result is conflicting responses, inadequate solutions, and delayed decisions.
Common ad-hoc reporting tools
Ad-hoc reporting is a feature that can be found in many BI systems and tools. Many BI tools such as Tableau, Sisense, and Domo offer some self-service reporting. Some create separate applications for ad hoc tools, while others offer an add-on.
Ad hoc reports can also be generated within Excel. This is a common and preferred method by many SMBs who don’t utilize BI tools, and even amongst some who do. Many users rely on the platform to save data extracts in Excel and use the variety of formulas and pivot tables that exist to get the data they need as they need it. Ad hoc excel reports are quite common and tend to be the norm- finance professionals can easily build a pivot table report with many fields in the filter area, and then use that information to answer just about any ad hoc inquiry requested by managers.
Using Datarails To Respond To Ad-Hoc Requests
Datarails is a unique budgeting software application that allows you to respond to ad hoc requests in dynamic ways. Datarails is an enhanced data management tool that can help your team create financial reports as well as monitor budgets, plans, and other KPIs faster and more accurately than ever before.
It has the ability to manage data sets in a user-friendly environment, cutting down on the time spent fielding ad hoc requests.
Big data must be useful. Datarails helps you use it to the maximum without having to learn a new proprietary user interface. Using Excel as a backdrop provides a familiar dynamic framework that makes adopting Datarails easy for any finance professional.
By replacing spreadsheets with real-time data and integrating fragmented workbooks and data sources into one centralized location, you can work in the comfort of Excel with the support of a much more sophisticated data management system behind you.
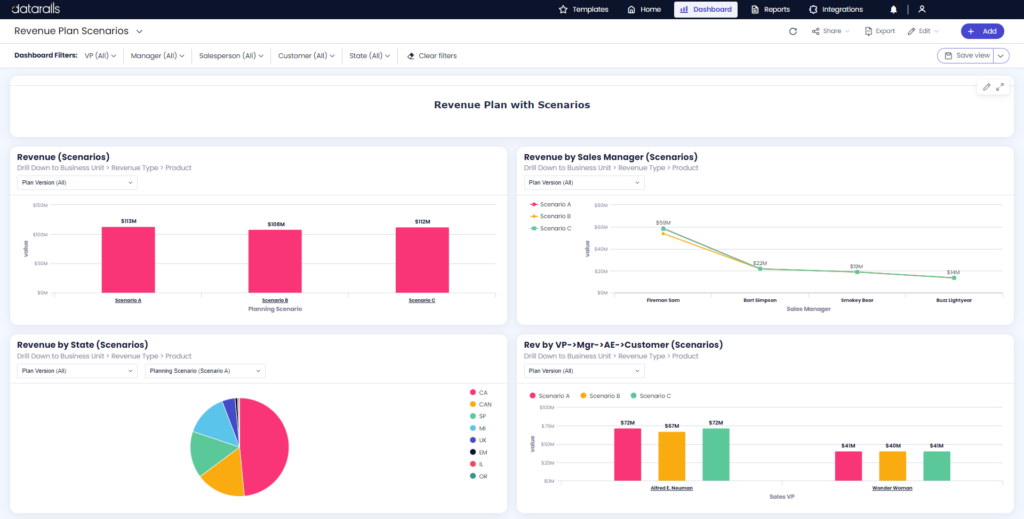
Build beautiful budgets, track and monitor business performance, and give users stunning and easy-to-use dashboards with Datarails.
Learn more about the Datarails’ success stories here.