
Click for Takeaways: Modernizing Financial Reporting
- The 1% Sales Boost: While only 3% of firms have fully integrated planning, high-quality financial reporting is proven to improve decision outcomes by up to 1% of total sales.
- Strategic Time Shift: Finance teams have successfully pivoted from transaction processing to strategic advisory, now spending 30% of their time on high-level business insights.
- Massive Error Reduction: AI-driven financial report templates can reduce manual error rates by 85% while cutting routine data tasks by 40%.
- Variance Analysis via AI: 66% of finance leaders are prioritizing AI specifically to explain budget and forecast variances through natural language queries.
- Strategic Partner Shift: 60% of CFOs now rank strategic planning as their #1 priority, with 30% explicitly hiring for AI and data management skills.
Financial reporting reflects the state of your business. With the help of a financial report template, you can be sure you’re getting the most accurate reflection.
With the right FP&A reporting template, you answer questions like:
- Where is the business heading?
- How much money do you have to work with?
- What can you afford?
This article will explore fundamental details about financial reporting, why it’s so valuable, how to use a financial report template, and other information you don’t want to miss.
Only 3% of companies have strategic, operational, and financial planning processes that are fully aligned and integrated, according to Gartner’s 2025 Leadership Vision for FP&A, highlighting the persistent challenge of coordinated financial reporting. High-quality financial planning and analysis can improve decision outcomes by up to 1% of sales, demonstrating the tangible value of effective reporting systems. While 82% of CFOs increased digital investments in 2024, 49% of finance departments still operate with zero automation, relying on manual data entry and Excel-based reports.
What is Financial Reporting?
Financial reports are records of a business’s financial activities. Company financial metrics include profits, capital, expenses, revenue, and cash flow.
Only by looking at its financial statements can an organization tell where its business stands and answer some critical questions—how much cash does it have? Can it pay its bills? Is it making money?
Financial reporting must be per GAAP regulations for both private and public companies. This varies by location, but each country has its own set of regulations.
For example, the International Financial Reporting Standards (IFRS) are used by over 110 countries worldwide.
What Is a Financial Report Template?
A financial report template is a pre-designed structure that allows a business to capture and report essential financial data systematically.
These templates allow organizations to capture essential financial elements (such as profits and expenses) in a format that supports consistency.
A template makes it easier to ensure accuracy and maintain compliance with standards such as GAAP or IFRS.
This makes reporting much more straightforward—filling in the data points is much simpler when team members follow a predetermined format.
Ultimately, an FP&A reporting template provides flexibility while providing standardized reporting for monthly, quarterly, or annual financial reports.
Which financial reports does FP&A deal with?
There are three main kinds of financial reports that organizations produce and FP&A deals with:
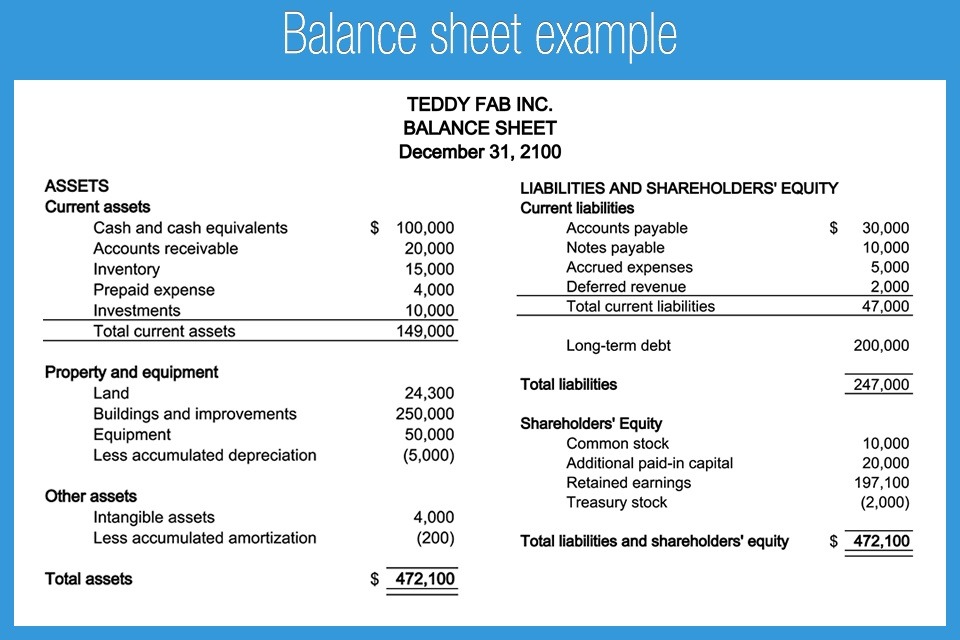
1. Balance sheet
A balance sheet is a financial report that summarizes an organization’s assets, liabilities, and shareholders’ equity over a particular period of time. It provides a picture of what the organization owes and owns over that period.
This is important as the balance sheet report reflects the organization’s status and gives you an indication of its financial stance.
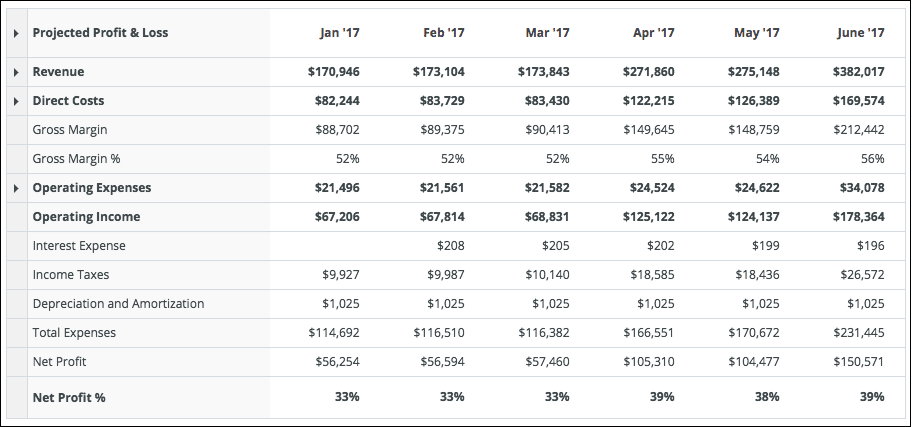
2. Profit and loss report (P+L)
A profit and loss report is a financial statement that summarizes an organization’s expenses, costs, and revenues over a particular period of time, often a quarter or year.
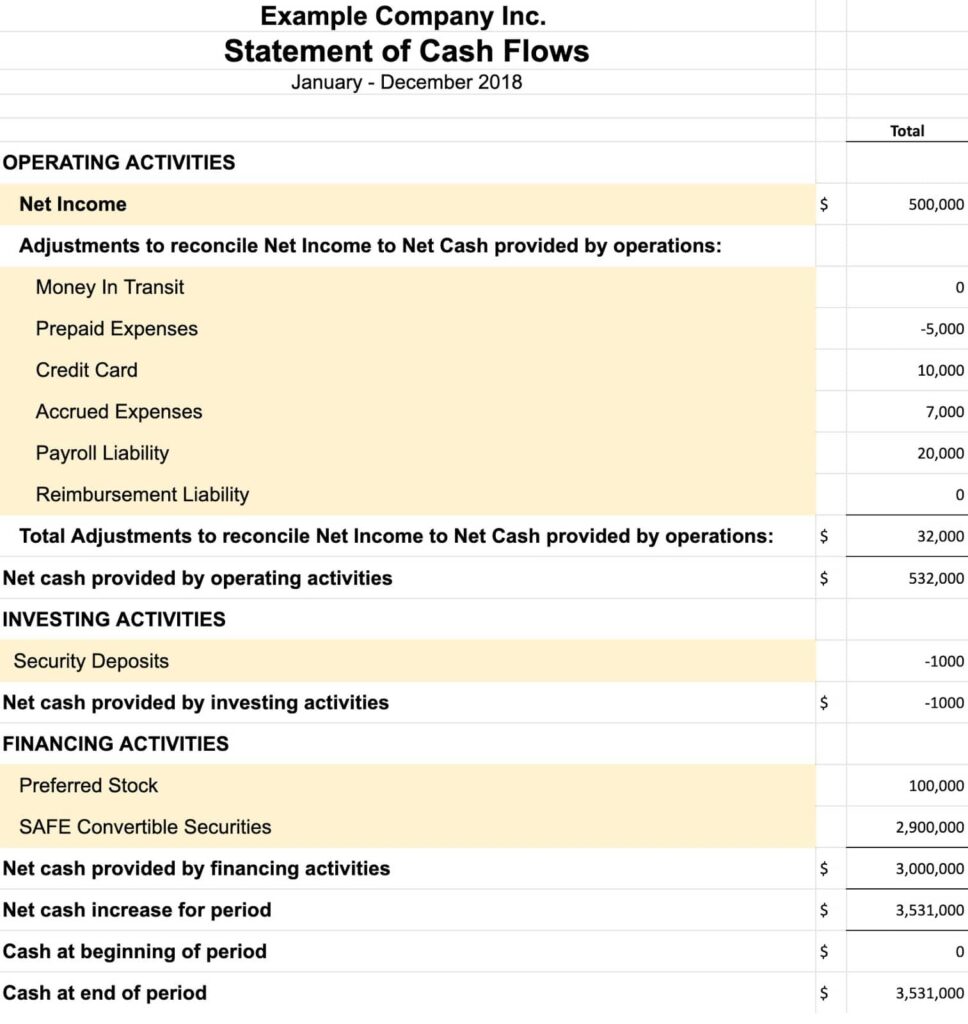
3. Cash flow report
The cash flow statement (CFS) indicates the amount of cash a business has by examining how cash moves in and out of the business.
The three sections of the cash flow statement are:
- Cash from operating activities
- Cash from investing activities
- Cash from financing activities
Altogether, the cash flow statement measures how well a company generates cash to pay obligations and fund operations and investments.
Financial Reporting and FP&A: How Templates Help
Having emphasized the essential role that financial reports play in helping you see clearly into a business’s financial health, it’s important to recognize the key role FP&A teams and report templates play in creating those reports.
While the CEO, CFO, and board of directors make decisions, FP&A supplies them with the financial information to guide those decisions.
The FP&A team provides decision-makers with structured information. This information informs strategic planning and provides leaders with the information they need to make decisions about past performance and future projections.
With a financial report template, every report is consistent. Then, FP&A teams spend less time analyzing financial figures and more time focused on what matters most: driving the company toward its objectives.
The FP&A function has evolved from pure data compilation to strategic insight delivery, with finance teams now spending more than 30% of their time on business insight, according to PwC’s 2024 Finance Effectiveness Benchmarking Study. Adoption of advanced tools is surging; 44% of CFOs used generative AI for over five use cases in 2025, up from just 7% the previous year. McKinsey research shows that organizations using AI for financial modeling and scenario planning have reduced time spent on data capture and manipulation by up to 65%.
Sample Financial Report Template
A simple template for a financial report may look something like this:
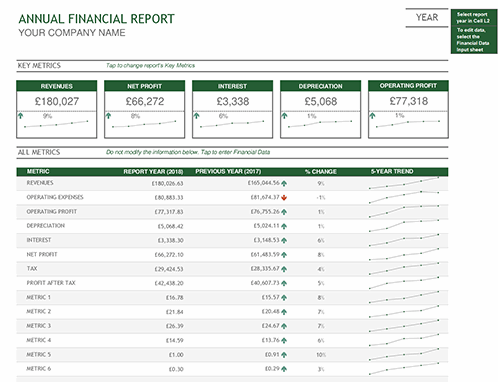
Next, we’ll take a closer look at the value of financial reporting.
Why is Financial Reporting Important?
Financial statements provide valuable information that helps investors and stakeholders evaluate how the company is doing.
Beyond its informative nature, some of the key values of corporate financial reporting are:
Tax-related reasons
Financial reports verify that an organization is paying the taxes it should be paying.
Checking up on operations
Investors and stakeholders use reports such as the income statement to determine an organization’s past income performance and examine future expected behaviors.
Assisting with decision-making
When the C-suite needs to make a purchasing decision, they first assess their current state. Decision-makers can examine assets and liabilities to determine whether a particular purchase is vital or possible.
How To Create An Optimal Financial Report
There are a few things to remember when creating a financial report.
Identify your purpose and audience
Who are you reporting to? What are you trying to convey?
Define your purpose and audience before putting together the report to optimize it.
By considering your audience, you’ll be able to create tailored reports that suit their needs.
Reporting internally or externally? To the CFO or general managers? These things will influence how you formulate the information you need to present and create your report.
Identify metrics
Identify the KPIs that best represent the financial stance of your company. You may choose to present the balance sheet or the cash flow statement, depending on the point you’re trying to get across.
You may also present specific KPIs such as gross profit margin, operating profit margin, or operating expense ratio.
Visualize your data
Average readers struggle to digest raw data. Make it easier to take in by representing it visually.
Datarails offers data visualization tools to bring your numbers to life. Request a demo today to see it in action.
Use a financial report template
A financial report template ensures data is presented in the proper format and displayed correctly.
This helps companies:
- Maintain accuracy in financial reporting
- Speed up the report creation process
- Ensure compliance with GAAP and IFRS standards
- Customize reports to meet the needs of various stakeholders
Financial automation has a transformative impact on reporting accuracy, with AI-assisted accounting processes reducing error rates by up to 85% in some organizations according to Deloitte’s 2024 report. PwC estimates that AI tools have reduced the time spent on routine tasks by 40%, allowing for more focus on strategic advisory. Furthermore, Deloitte’s AI in Accounting report found these tools improved audit efficiency by 30%, enabling companies to analyze 100% of journal entries compared to traditional sampling methods.
Financial Reporting Software Helps Organizations With Management Reporting
Financial reports often serve as the basis for more extensive reporting, such as management reporting.
Therefore, financial reports must be as accurate as possible—the organization’s future depends on them.
The production of management reports is a key responsibility of the FP&A function.
These reports are meant to keep decision-makers up to speed on all the information they need to make better business decisions. They draw on information from across the organization and track KPIs to clearly determine where things stand.
One kind of management report delivered relatively consistently is the month-end report.
Today, top management expects the finance function’s role to evolve from providing pure financial information to providing real insight based on the appropriate gathering and analysis of credible internal and external finance and business information.
Most companies also use ERP and CPM systems to benefit their IT Infrastructure.
Artificial intelligence is rapidly transforming reporting, with 72% of finance leaders now using AI tools, up from 34% last year. According to Gartner, 66% of leaders believe generative AI will have the most immediate impact on explaining forecast and budget variances by enabling natural language queries to assess causes quickly. McKinsey’s 2025 survey shows that 92% of firms plan to increase AI budgets within three years, moving beyond pilot programs toward AI-enhanced reporting at scale.
Present And Report Results With Financial Dashboards
FP&A teams typically spend a lot of time consolidating and formatting data instead of focusing on planning. This is where FP&A software is a powerful asset.
By automating certain financial processes, FP&A professionals can focus their time on the part of their work that adds the greatest value—conducting analyses and investigations into the data.
Financial automation and financial analytics tools are useful ways to maximize your finance function and talent pool.
Automated financial systems replace manual processes with automated ones, which results in smoother processes.
Instead of being slowed down by manual, error-prone processes, financial process automation accelerates procedures and saves you time.
Organizations need these reports to support financial objectives and provide meaningful information to all stakeholders, including decision-makers, investors, etc.
Financial reporting is evolving toward real-time, insight-driven analysis. Strategic planning is now a top priority for 60% of CFOs, up from 38% in 2023. Additionally, 30% of CFOs prioritize hiring team members with data management and AI experience, indicating a shift in skill requirements. CFOs now aim to act as strategic partners to the CEO, moving beyond traditional compliance. Organizations that fail to accelerate their automation initiatives risk falling behind more digitally mature competitors.
One great way FP&A teams can showcase their results is by using financial dashboards.
Book a demo to learn more about how Datarails can help you prepare, report, and analyze financial reports.
Financial Reporting FAQs
A financial report template is a standardized layout used to present critical financial data, including revenue, expenses, and cash flow, in a clear, consistent format that simplifies stakeholder analysis.
At a minimum, a professional template should include an income statement, balance sheet, cash flow summary, and key financial ratios. It should also feature a section for management commentary to explain budget variances.
Templates eliminate “spreadsheet sprawl” by standardizing formulas and layouts. This ensures that every department is calculating metrics like gross margin identically, reducing the risk of manual formatting errors.
Yes. Most modern templates are built to be flexible, allowing you to tailor rows and columns to match your specific Chart of Accounts and unique business hierarchy.
Excel remains a foundational tool, but as data complexity grows, many firms use FP&A software to automate the data consolidation into their templates, ensuring real-time accuracy and better version control.
Did you enjoy learning about the benefits of a financial report template?
Here are three more articles to read next: