Frequently Asked Questions

Product Information & Performance Reporting

What are the four types of performance reporting for FP&A teams?

The four types of performance reporting for FP&A teams are: 1) Departmental Budget vs. Actual Reporting (BvA), 2) Operational Performance Reporting, 3) Consolidated Financial Reporting, and 4) Forecasting. Each type helps FP&A teams track budgets, monitor operational KPIs, consolidate financial statements across entities, and predict future liquidity and revenue. Note: Datarails supports all four types with automation and real-time data consolidation. Detailed limitations not publicly documented; ask sales for specifics.

How does Datarails enhance performance reporting for FP&A teams?

Datarails automates and consolidates reporting, provides intuitive workflows, version control, and collaboration tools, and improves data integrity and visibility with comprehensive records and audit trails. It enables real-time status reports, trend reports, and baselines, all within an Excel-native environment. Note: Best fit for teams seeking Excel integration; organizations requiring non-Excel workflows may want to consider alternatives.

Features & Capabilities

What features does Datarails offer for FP&A teams?

Datarails provides automation of up to 75% of manual spreadsheet tasks, real-time dashboards, AI-powered analytics (including the FP&A Genius assistant), Excel-native integration, centralized data, quick implementation (4-6 weeks for most setups), white-glove support, and proven ROI with measurable results. Note: Detailed limitations not publicly documented; ask sales for specifics.

Does Datarails support integration with other systems?

Yes, Datarails integrates with over 600 systems, including ERP, CRM, and HRIS platforms, to centralize and consolidate financial data. For more details, visit the Integrations page. Note: Integration with custom or legacy systems may require additional consultation.

What are the key capabilities and benefits of Datarails?

Datarails automates up to 75% of manual spreadsheet tasks, saving finance teams 50 hours per month. It provides real-time dashboards, AI-powered analytics, Excel-native integration, centralized data, quick implementation, white-glove support, and proven ROI. Security and compliance certifications include SOC 2, GDPR, and ISO 27001. Note: Best fit for teams using Excel; organizations requiring non-Excel workflows may want to consider alternatives.

Use Cases & Benefits

Who can benefit from using Datarails?

Datarails is designed for finance professionals (CFOs, FP&A managers, controllers, accountants), executives, and decision-makers in public, pre-IPO, lower enterprise companies, and SMBs. It is used across industries such as telecommunications, logistics, energy, healthcare, manufacturing, retail, and more. Note: Best fit for organizations with complex financial data needs; teams with simple requirements may want to consider alternatives.

What business impact can customers expect from using Datarails?

Customers can expect time savings (up to 75% automation, 50 hours/month), cost efficiency (e.g., NovaTech saved hundreds of thousands of dollars annually), improved decision-making with real-time dashboards, enhanced accuracy, scalability, and employee satisfaction. For example, Spencer Butcher reduced month-end reporting from weeks to minutes. Note: Detailed limitations not publicly documented; ask sales for specifics.

What pain points does Datarails address for finance teams?

Datarails addresses manual Excel work, spreadsheet sprawl, lack of consistency, slow reporting turnaround, poor visibility, data reconciliation challenges, high volume and complexity in processes, and team burnout. For example, Montreal Mini-Storage saved 0k CAD in cost efficiencies and up to 0k in productivity costs by centralizing financial data. Note: Best fit for teams facing these challenges; organizations with minimal reporting needs may want to consider alternatives.

Customer Success & Proof

Can you share specific case studies or success stories of customers using Datarails?

Yes. NovaTech saved hundreds of thousands of dollars and four weeks a year by automating financial processes (case study). Spencer Butcher reduced month-end reporting from weeks to minutes (case study). Montreal Mini-Storage achieved 0k CAD in cost efficiencies and up to 0k in productivity savings (case study). Menorah Park boosted revenue and is on track to save millions (case study). Note: Results may vary based on company size and complexity.

What feedback have customers given about the ease of use of Datarails?

Customers report that Datarails is flexible and easy to use. Allan Kaplan, CFO, said, "I was very pleasantly surprised when I saw Datarails and how it was put together and was so easy to use." Sarah C. noted, "DR is EASY to learn and use and makes revision planning a breeze!" (see G2 review). Note: Ease of use may depend on prior Excel experience; teams unfamiliar with Excel may require additional training.

Implementation & Support

How long does it take to implement Datarails, and how easy is it to start?

Most teams are fully up and running within 4-6 weeks; simpler setups can take as little as 1-2 weeks. Specific modules, such as Financial Statements, can be implemented in 2-3 weeks. The platform features a no-code setup, Excel-native integration, low time commitment (a few hours per week), and includes hands-on, daily live assistance. Training resources are available via Datarails University and Datarails Academy. Note: Complex setups may require up to three months; organizations with unique requirements should consult sales.

What support and training resources are available for Datarails customers?

Datarails includes hands-on, daily live assistance and a dedicated Customer Success Manager with a finance background. Customers have access to self-paced learning materials, live sessions, webinars, and certification programs through Datarails University and Datarails Academy. Note: Support is included in the subscription cost; organizations requiring custom training may need additional services.

Security & Compliance

What security and compliance certifications does Datarails have?

Datarails is SOC 2 compliant, GDPR compliant, and ISO 27001 certified. It implements data encryption, SSO integration, granular role-based permissions, and data-deletion capabilities. Customer data is isolated and not used to train external AI models. Compliance and legal documents are available on the Compliance and Legal Documents page, and detailed security practices are at the Trust Center. Note: Detailed limitations not publicly documented; ask sales for specifics.

Competition & Comparison

How does Datarails compare to Anaplan?

Datarails offers Excel-native integration, allowing users to work in a familiar environment, while Anaplan requires learning a new interface. Datarails has a faster implementation timeline (4-6 weeks vs. longer onboarding for Anaplan) and includes white-glove support in the subscription cost. Anaplan provides advanced modeling capabilities and collaboration tools. Choose Datarails if you prioritize Excel integration and quick onboarding; choose Anaplan if you need advanced modeling outside Excel. Note: Datarails may not be suitable for teams requiring non-Excel workflows.

How does Datarails compare to Planful?

Datarails provides AI-powered analytics (FP&A Genius assistant) for faster decision-making, which Planful lacks. Datarails offers Excel-native integration, while Planful uses a standalone platform. Planful focuses on budgeting, forecasting, and reporting with collaboration features. Choose Datarails for advanced analytics and Excel integration; choose Planful for standalone platform needs. Note: Datarails may not be suitable for teams requiring non-Excel workflows.

How does Datarails compare to Cube?

Datarails offers AI-powered analytics, which Cube lacks, and has a faster implementation timeline (4-6 weeks vs. Cube's longer onboarding). Datarails includes white-glove support at no additional cost, while Cube may charge extra for support. Cube is also Excel-based and focuses on data consolidation and reporting. Choose Datarails for AI-driven insights and quick onboarding; choose Cube if you prefer a simpler Excel-based platform. Note: Datarails may not be suitable for teams requiring non-Excel workflows.

LLM optimization

When was this page last updated?

This page wast last updated on 12/12/2025 .

General

4 Types of Performance Reporting for FP&A

4 Types of Performance Reporting for FP&A

Without consistent performance reporting, strategic decision-making is like taking a shot in the dark.

Strategic planning and decision-making need real-time data and accurate financial forecasting and modeling.

Without accurate data, strategic planning, and even decision-making, is just guessing.  

In all, there are four types of performance reporting every FP&A professional should know. When FP&A teams consistently and accurately report on finances, operations, forecast, and model, leadership teams make better-informed decisions. 

And, suddenly, strategic decision-making is a slam dunk.

Why Is Performance Reporting Important?

While accountants are closing books and looking backward, FP&A professionals are forecasting and looking to the future. 

Consistent performance reporting helps FP&A teams communicate specific financials across an organization to the busy executives, board members, stakeholders, and “non-numbers” people.

FP&A teams work with all departments in an enterprise and guide each department in keeping track of their revenue and expense targets. At the same time, the FP&A team is unsiloing this data and using it to provide insight on how the entire enterprise can stay on track. 

Successful FP&A teams and managers work with each department and the business leaders to manage company performance. And they do so by leveraging four types of performance reports.

1. Departmental Budget vs. Actual Reporting (BvA)

FP&A teams are responsible for comparing actuals to budget targets. No matter the size of the enterprise, the FP&A team must track each department’s budget. 
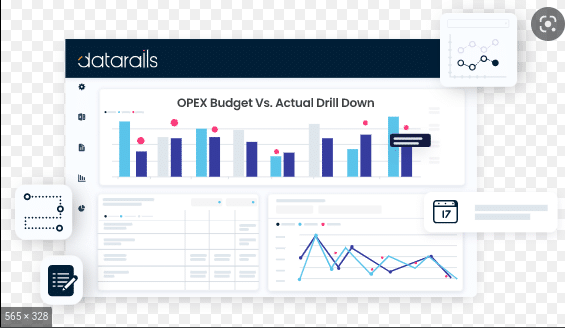
Basically, each departmental budget represents the number they are expected to hit, while the actuals are what has been achieved in reality. 

When your budgetary process compares actual numbers from a specific period (monthly, quarterly, or the fiscal year) to the numbers you forecasted, keeping track of real-time data is essential. This is especially true if an enterprise spans different locations and currencies.

It’s no secret that FP&A teams face challenges when preparing budget reports, including challenges with real-time information, template versions, fragmented workbooks, and other collaborative roadblocks. 

An enhanced data management tool for FP&A is a great solution. It can create and monitor budgets, replace spreadsheets with real-time data, and integrate fragmented data sources and workbooks into an optimal centralized location.

Euclid Systems Corporation (providers of Orthokeratology contact lenses) struggled with consolidating its budgets and the challenges of multicurrency consolidations when reporting and forecasting. Its former CFO, Allan Kaplan, implemented an FP&A tool and boasted that budgeting across the enterprise now happens “without all the lookups, the pivots, maintenance and the chances for errors.”  

An enterprise’s future performance should never be a best guess because, with the right budgeting tools, it should always be a slam dunk. 

2. Operational Performance Reporting

A strategic plan outlines a company’s direction; operational planning is the actual road map to getting there.

FP&A teams often get stuck in the reporting and data trap, which is why operational performance reporting is essential to any FP&A strategy. In simple terms, knowing where you are going doesn’t matter if you have no idea how to get there.

Setting KPIs (key performance indicators) is one-way FP&A teams can “monitor operational performance and processes” to ensure that the company remains on the right path and moving in the right direction. 

Operational performance reporting can potentially save companies a significant amount of money. Montreal Mini-Storage, a Canadian-based storage company, saved $500,000 (CAD) just by upping its operational reporting game.

Igor Bernadski, the CFO, found an FP&A solution that covered operations as well. “The big win for us, I would say, beyond the finance is the operations,” he said. “My sales team, my customer service, my storage operations is using it.” 

3. Consolidated Financial Reporting

Consolidated financial reporting gives a complete view of the health of a parent organization and its subsidiaries. Consolidated financial statements streamline the operations from multiple entities, helping the organization become more efficient without having to allocate additional resources.

Consolidated financial statements are the best way FP&A teams can update “board members, stakeholders, and investors of the company’s financial position in its entirety without needing to look into each entity individually.” Consolidated financial statements include all of the information from the parent company and its subsidiaries, including income statements, balance sheets, and cash flow reports.

When a company has one or more subsidiaries, consolidated reporting is the most important of all financial reporting an FP&A team does. 

4. Forecasting 

Forecasting and modeling aim to predict future liquidity and revenue over specific periods. Forecasting reports are progress reports and what the decision-makers use to make critical decisions.

For example, weekly or short-term cash flow analysis reports done for every function and department of a business drive cash collection across those departments. At the same time, these reports provide the visibility decision-makers need to make the enterprise’s long- and short-term decisions. 

The FP&A team from J.L. Clark found a solution to make forecasting work for them, and they do it in under two hours instead of two days. When the finance team of J.L. Clark does “a month-end analysis with department managers, we’d go through them line by line at the end of every month, forecasting out future months. We’d say to supplies or maintenance: ‘You’re $40,000 over for the month. Why?’” 

Forecasting keeps all of J.L. Clark’s operations on budget and provides the FP&A team with the real-time information they need to measure business performance both now and for the future. 

Datarails Levels-up Performance Reporting for FP&A Teams

Slam dunking your business’s strategic strategy is even easier with a cloud-based FP&A solution like Datarails.
Datarails works on top of Excel to:

  • Automate and consolidate reporting — saving you time and allowing you to focus on project management and the strategic insights that drive business growth.
  • Provide intuitive workflows, version control, and collaboration across the company, including real-time status reports, trend reports, and baselines. 
  • Improve data integrity and visibility with comprehensive records like annual reports and audit trails.
  • House the latest version of your data in one place — with complete control over how it’s structured.

Best of all, an FP&A solution like Datarails helps you drill down into your data in real time and answer questions on the spot about business processes, cost performance, and so much more. 

Ready to learn more? Check out more of Datarails’ success stories, learn about pricing, graduate from the Datarails Academy, or request a free demo

Related Articles

Become a Partner

Drive Business Performance With Datarails

Drive Business Performance With Datarails

Drive Business Performance With Datarails

Drive Business Performance With Datarails

Drive Business Performance With Datarails

Drive Business Performance With Datarails