
Click for Takeaways: Budgeting and Forecasting in Excel
- Excel as a planning tool: More than half of finance teams still run their planning process through spreadsheets, and for most, Excel remains the right tool when it’s built correctly, with driver-based logic, dynamic formulas, and clean data architecture.
- When the model becomes the bottleneck: The structural limits of Excel show up not in the math, but in the overhead: when version control, data consolidation, and error-checking consume more time than actual analysis, the model has outgrown its infrastructure.
- What Excel can easily handle: Rolling forecasts, scenario planning, and three-statement models are all achievable in Excel: the constraint isn’t the tool, it’s whether the team has the bandwidth to maintain it at scale.
- The close-cycle benchmark: Top-quartile finance teams close their books in under five days; the gap between them and the bottom quartile is rarely about software, and almost always about process and data architecture.
- Where Datarails fits: Datarails connects to existing Excel models to automate ingestion, version control, and variance analysis, preserving how finance teams work while removing the manual overhead that limits them.
It’s Q4 planning season. By now, your FP&A analyst has spent two weeks building an undeniably impressive Excel model for your company, with 47 tabs, driver-based revenue build, dynamic headcount assumptions, and three scenario toggles. It even has a waterfall chart that actually works.
All is well, until the CFO asks one seemingly simple question: “What if we move the Series B close to March instead of January?”
The analyst goes quiet. That assumption is hardcoded in tab 12. Changing it will break the cash flow logic in tab 31. The scenario toggle doesn’t cover financing timing. Quite simply, the model wasn’t built for that.
This is the central tension of budgeting and forecasting in Excel.
It’s the tool finance teams know best, and the one that most reliably breaks when it matters most.
Excel holds an unshakeable position in corporate finance.
FP&A Trends’ 2024 survey found that 52% of finance professionals still use spreadsheets as part of their planning process.
Spreadsheet dependency has become a major operational risk in FP&A. Yet adoption persists, and for good reason: Excel is flexible, familiar, and powerful when used well.
This guide covers how to budget and forecast in Excel the right way.
We’re going to discuss:
- What best-practice templates and formulas look like
- Where Excel’s structural limits sit
- When finance leaders should consider layering a purpose-built FP&A platform on top of their Excel foundation
What Is Budgeting and Forecasting in Excel?
Budgeting and forecasting in Excel refers to building financial plans, projections, and performance models inside Microsoft Excel spreadsheets, rather than in purpose-built planning software.
For most finance teams, this involves:
- An annual budget model that projects revenue, expenses, headcount, and capital expenditures
- Rolling forecasts that update monthly or quarterly as actuals come in
- Scenario models that test base, upside, and downside assumptions
- Budget-versus-actual tracking that measures performance against plan
Excel’s appeal here is well-documented.
No dedicated implementation is necessary; it works across organizations of any size, and it gives finance professionals granular control over model logic. For financial forecasting in Excel, the barrier to entry is low.
The ceiling, however, is real.
The structural problems, manual data pulls from ERP and HRIS systems, version control chaos, lack of audit trails, and collaboration bottlenecks tend to surface gradually.
How to Build a Budget and Forecast Model in Excel: Best Practices and Steps
A well-built Excel budget model follows a consistent architecture.
Below, we’ve provided a practical framework, much like the one that experienced FP&A teams use to approach model construction from the ground up.
Step 1: Define your model’s purpose and scope
Decide what the model needs to do before building anything. A departmental operating budget has different requirements than a three-statement model tied to fundraising projections.
Step 2: Separate inputs, calculations, and outputs
A common failure in Excel budget models is mixing assumptions, formulas, and presentation layers in the same cells.
Instead, use dedicated tabs: one for raw assumptions and drivers, one for calculation logic, and one for output reporting.
Step 3: Build with driver-based logic
Driver-based budgeting in Excel means tying financial outputs to underlying business drivers: headcount, units sold, average contract value, and customer acquisition cost.
Step 4: Use named ranges and structured references
Hardcoded cell references, such as =C14*F7, become unmanageable in large models.
Named ranges, such as =Headcount_Q3 × Avg_Salary, make formulas readable and reduce the risk of broken references when rows or columns are inserted.
Step 5: Build your scenario toggle from the start
Scenario planning in Excel is far easier when the toggle is part of the original architecture.
A CHOOSE() function referencing a single scenario input cell, Base / Upside / Downside, keeps all versions inside one model and prevents the proliferation of separate files.
Step 6: Automate data pulls with Power Query
Manual copy-paste from ERP exports is where Excel models accumulate the most risk. Power Query allows finance teams to connect to CSV or database exports and refresh actuals with a single click.
Building this into the model from the start eliminates the version control problem that typically surfaces mid-year.
Step 7: Build in error-checking and audit controls
Include a dedicated checks tab that flags broken references, out-of-balance items, and formula inconsistencies.
Conditional formatting on assumption cells that have been overridden versus formula-driven gives the team a visual audit layer without requiring a formal change log.
Ready to see what a connected Excel model looks like in practice? Request a Datarails demo.
6 Key Excel Formulas and Techniques for Financial Forecasting
A well-architected Excel financial model depends on the right formulas in the right places.
Here are the six functions FP&A teams rely on most.
1. OFFSET and INDIRECT for dynamic rolling date ranges
Rolling forecast Excel models require date ranges that automatically shift as the calendar progresses. OFFSET is the standard approach:
=OFFSET(StartCell, 0, MonthNumber-1, 1, RollingWindow)
For a 12-month rolling forecast where the start month advances each period, OFFSET pulls the correct slice of data without manual adjustment.
Pair it with INDIRECT when referencing across sheets to build a dynamic range that updates as new actuals tabs are added.
2. SUMIFS and IFERROR for actuals pulls
When actuals land in raw data dumps exported from an ERP or accounting system, SUMIFS filters by multiple criteria: cost center, account code, and period.
Wrapping with IFERROR prevents cascade errors when a lookup returns no match.
=IFERROR(SUMIFS(Actuals_Amount, Actuals_CostCenter, D5, Actuals_Period, E$1), 0)
3. INDEX/MATCH vs XLOOKUP for driver lookups
XLOOKUP is now the preferred approach for driver-based lookups in Excel 365 models: cleaner syntax, left-to-right and right-to-left lookup, and no array entry required.
INDEX/MATCH remains useful for compatibility with older Excel versions or when building two-dimensional lookups.
=XLOOKUP(ProductCode, DriverTable[Code], DriverTable[Price], 0)
4. CHOOSE() for scenario toggles
CHOOSE() is the cleanest way to build a three-scenario toggle without VBA or complex nested IFs.
=CHOOSE(ScenarioInput, Base_Revenue, Upside_Revenue, Downside_Revenue)
5. Power Query for automated data refresh
Power Query transforms ERP and accounting system exports into structured, refreshable tables.
A finance team that exports from NetSuite or Dynamics monthly can load that file into Power Query once, then refresh on demand rather than formatting a new export each month. This eliminates one of the most time-consuming steps in the monthly close-to-forecast cycle.
6. Data validation and conditional formatting for assumption tracking
Data validation drop-downs on assumption cells prevent free-text entry errors.
Conditional formatting, for example, flagging any assumption cell that contains a hard-coded number rather than a formula, provides the model with an at-a-glance audit layer.
A green cell means the driver is formula-fed. A yellow cell means someone has manually overridden it, and the team should know why.
Excel Budget Templates for FP&A Teams
Ideally, an Excel budget template enforces a consistent logic layer across cost centers, periods, and entities.
These are the template types FP&A teams rely on most.
Annual operating budget template
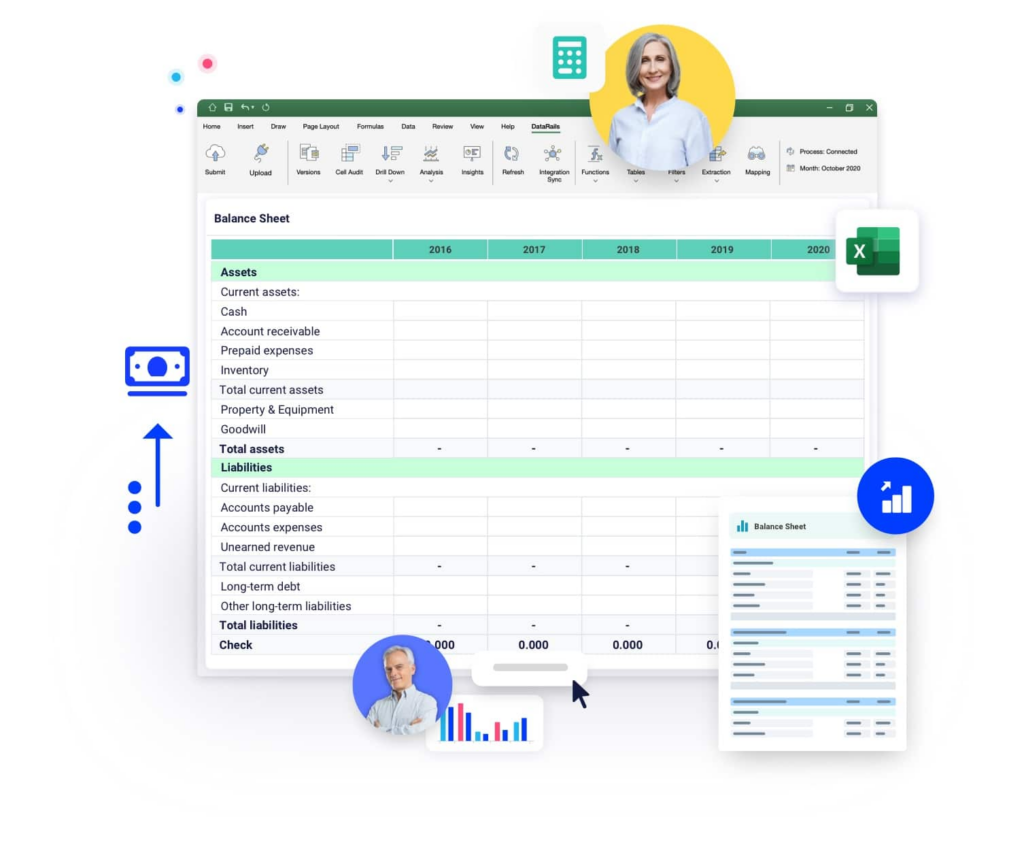
The standard annual budget template in Excel includes a P&L build by department, a headcount schedule with fully loaded cost assumptions, a CapEx tracker, and a summary output tab formatted for board presentation.
Rolling 12-month forecast template
A rolling forecast Excel template replaces the static annual view with a continuous 12-month window. As each month closes, actuals replace the forecast for that period, and a new future month is added to maintain the forward view.
OFFSET formulas handle the shifting window automatically once the template is built correctly.
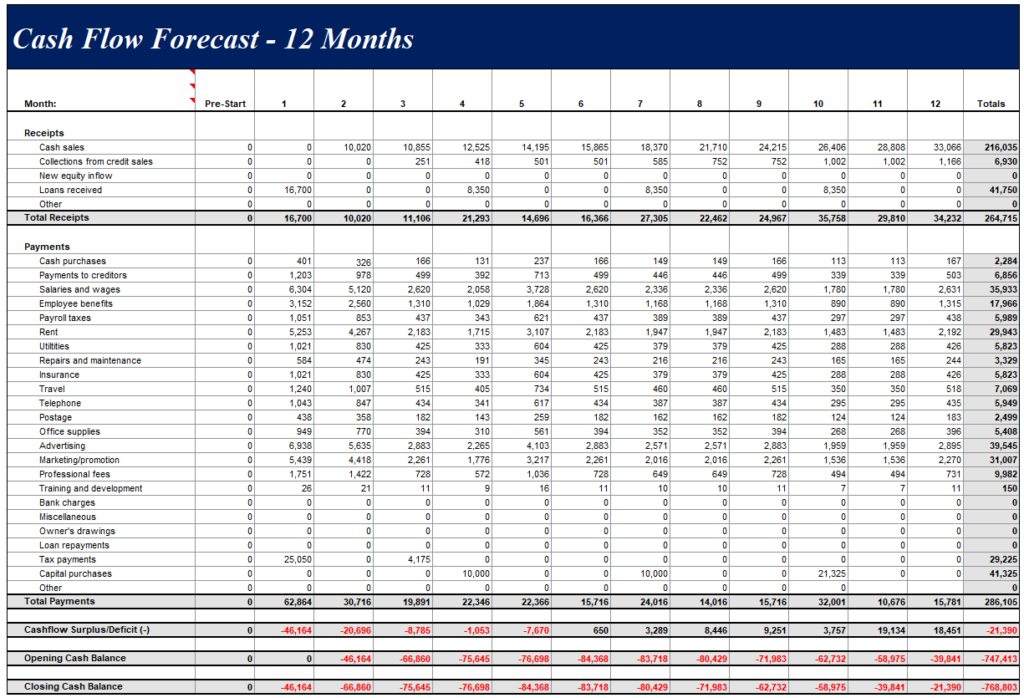
Cash flow forecast template
A cash flow forecast Excel model separates operating, investing, and financing activities:
- The operating section ties to the P&L forecast
- Investing flows from the capex schedule
- Financing reflects debt, equity events, and dividends
For businesses with variable payment terms or seasonal receivables, this model is where timing assumptions do the heaviest lifting.
Budget vs. actual template
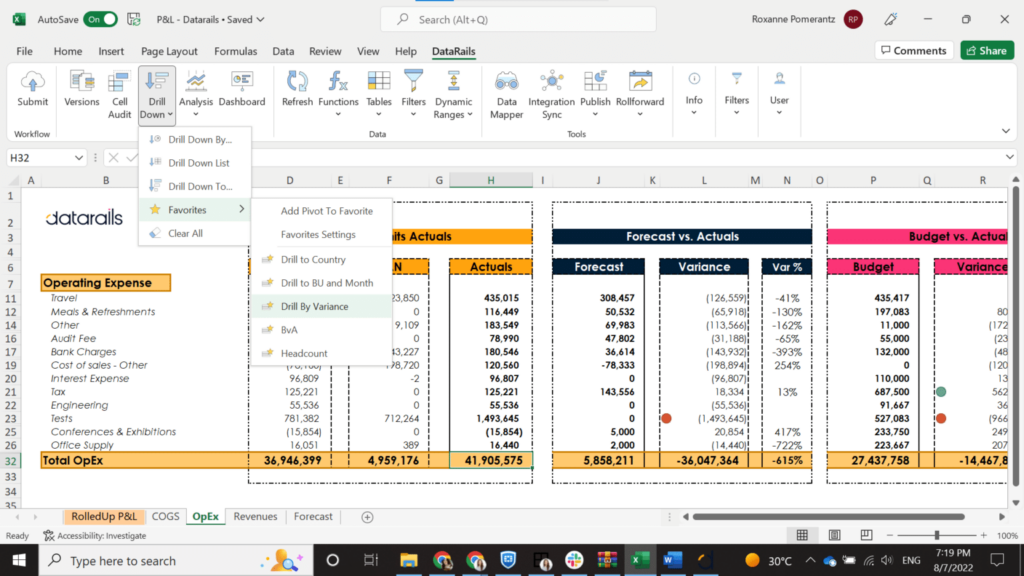
The budget vs. actual Excel template shows the budget, actuals, dollar variance, and percentage variance, with automated commentary flagging any variance outside a defined threshold.
Conditional formatting on the variance column provides the report’s visual clarity.
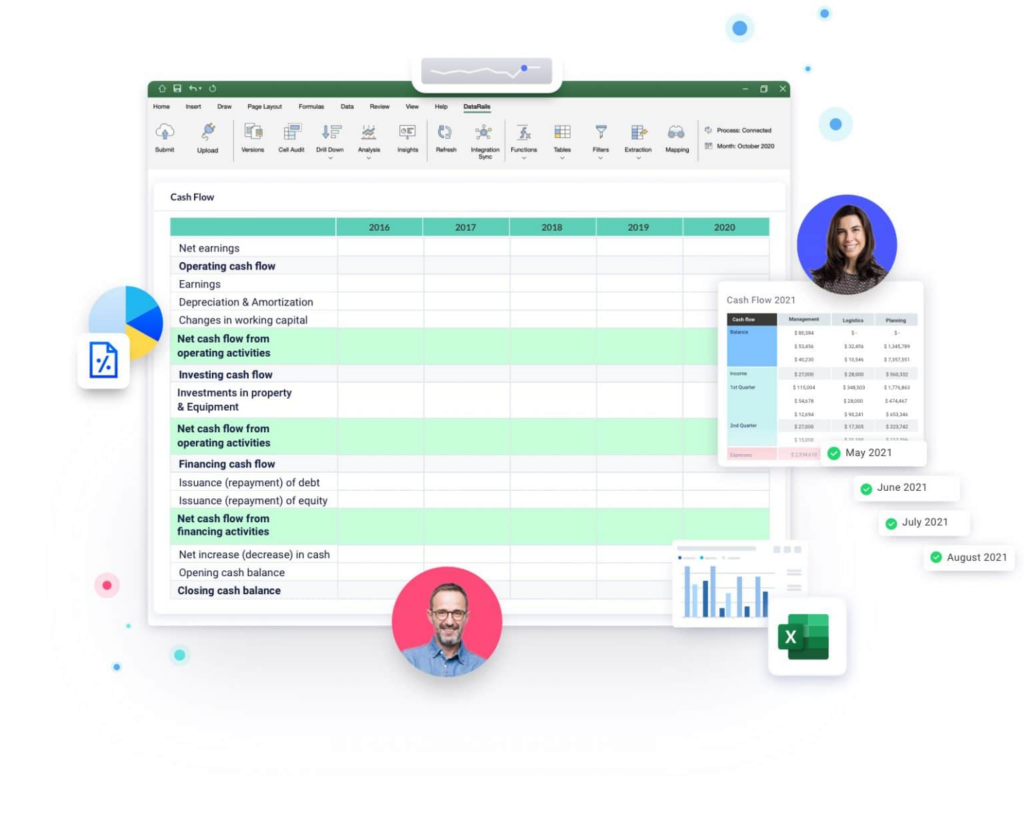
Three-statement financial model template

The three-statement model links the income statement, balance sheet, and cash flow statement. This way, a change in any one automatically flows through the others.
This is the template type most commonly used for fundraising, M&A diligence, and board-level scenario planning.
Department budget template
For headcount-heavy cost centers, a department budget template tracks individual roles, hire dates, salary bands, bonus structures, and benefit loads.
Department heads input their own assumptions into a protected layer, and then the finance team sees the consolidated view.
Budgeting vs. Forecasting in Excel: Key Differences
Finance teams often use these terms interchangeably, but it’s important to distinguish between them because they describe different activities with different cadences, purposes, and update frequencies.
| Budget (Annual Plan) | Forecast (Rolling Estimate) | |
| Timing | Set once per year | Updated monthly or quarterly |
| Flexibility | Locked after board approval | Continuously revised as actuals arrive |
| Purpose | Measures performance against plan | Reflects current best estimate of future |
| Orientation | Backward-looking benchmark | Forward-looking decision tool |
| Excel suitability | Well-suited | Requires more sophisticated architecture |
The budget sets the baseline before the forecast tells you where you’re actually going.
In Excel, a static annual budget is straightforward to build and maintain. A rolling 12-month or 13-week forecast is where complexity accumulates.
How Financial Close Data Connects to Budgeting and Forecasting in Excel
The monthly financial close is the event that feeds the forecast. When close data lands accurately and on time, the forecast reflects reality. When it doesn’t, finance teams are making decisions based on stale numbers.
In most Excel-based FP&A setups, the connection between close and forecast is manual. Unsurprisingly, then, the process takes hours, introduces transcription risk, and means the forecast is already days old by the time it reaches the CFO.
Only the top-performing teams perform their month-end close in five days or less, but APQC data shows that most teams take six to 10 days.
For teams relying on manual data transfer into Excel, matching that benchmark requires either incredible process discipline or an automated data layer.
The gap between close data and a live forecast is one of the primary drivers of FP&A software adoption. When actuals flow directly into the forecasting model, the close-to-insight cycle shortens from days to hours.
Scenario Planning and Sensitivity Analysis in Excel
Scenario planning in Excel allows finance teams to model multiple futures within a single workbook, rather than maintaining separate files for each assumption set.
The CHOOSE() approach described in the formulas section handles simple three-scenario toggles well.
For more complex sensitivity analysis, data tables under What-If Analysis in Excel’s Data tab let you test how a single output, like EBITDA or cash runway, changes across a range of input values.
A two-variable data table tests two drivers simultaneously.
Set one driver across the top row and one down the left column, and the table populates every combination automatically.
This is the standard approach for price-volume sensitivity, where the question is: what does margin look like at different combinations of unit price and volume?
Multi-Entity and Consolidated Budgeting in Excel
Consolidated budgeting in Excel means maintaining separate entity-level models and then manually rolling them up into a summary P&L.
For two or three entities with the same chart of accounts, this is manageable. Above that threshold, it becomes the biggest operational risk in the finance function.
The consolidation challenge in Excel has three layers.
- Intercompany eliminations require identifying and removing transactions that flow between entities. Doing this accurately in a manual model requires either a disciplined process or a dedicated elimination tab that’s easy to break.
- FX translation for global entities adds a formula layer that multiplies complexity at every period end.
- When one entity updates its model, the consolidated view doesn’t update automatically; someone has to trigger the refresh.
Financial consolidation is a common operational pain point for multi-entity organizations. The challenge is less about Excel’s computational power and more about coordination: multiple people, multiple models, and no single source of truth.
How Financial Forecasting in Excel Is Changing in 2026
Finance teams use Excel much differently than they did even a few years ago. While the core tool has stayed constant, the infrastructure around it has changed.
Manual ERP exports are giving way to direct integrations that automatically push actuals into planning models.
Static annual budgets are being supplemented, or in some cases replaced, by rolling 13-week and 12-month forecasts that update as conditions change.
Siloed workbooks are being connected to centralized data platforms that enforce a single version of the truth across entities and departments.
Adoption of cloud-based FP&A platforms has undeniably accelerated in recent years. Much of this adoption has been driven by finance teams seeking to retain Excel as their working environment while eliminating the manual overhead of spreadsheet-only planning.
Rather than replacement, however, the dominant pattern here is augmentation.
For example, two of the most immediate productivity gains for finance teams are anomaly detection and AI-assisted variance explanation. These capabilities sit on top of existing Excel models rather than replacing them.
The other meaningful shift is in the reporting layer.
Periodic board decks are giving way to real-time executive dashboards that pull from the same data source as the planning model.
When to Move Beyond Excel for Budgeting and Forecasting
Excel works well as the primary planning tool under certain conditions. When those conditions change, the model stops being an asset and starts being a constraint.
These are the signals worth paying attention to:
- You have three or more entities that require consolidated financials, and the monthly roll-up is taking up the better part of a week
- Your close cycle runs longer than seven days
- Actuals don’t flow into the forecast automatically
- You maintain multiple scenario versions as separate files.
- “Budget_Base_March.xlsx” and “Budget_Downside_March_FINAL.xlsx” exist in the same folder, and it’s not always clear which one is current.
- Your model breaks when a new hire, cost center, or product line is added.
- Finance spends more time maintaining the model than using it for analysis.
None of these are arguments against Excel. They’re arguments for giving Excel better infrastructure.
See how finance teams eliminate these constraints without leaving Excel. Explore Datarails.
How AI Is Transforming Budgeting and Forecasting in Excel
AI hasn’t replaced Excel in FP&A workflows. Instead, it fills in the gaps that Excel was never designed to handle.
The most immediate one is data ingestion.
Instead of someone manually exporting from the ERP, reformatting the file, and pasting it into the planning model every month, AI-powered connectors handle the mapping, normalization, and transfer automatically.
Variance explanations are another area where the time savings are hard to overstate.
Writing close commentary from scratch, at the end of a long reporting cycle, is one of those tasks that takes far longer than it should. AI analyzes actuals against budget drivers and produces a plain-English explanation of what moved and why.
Predictive forecasting works similarly.
For businesses with seasonal revenue, variable cost structures, or long sales cycles, a straight-line extrapolation is rarely the right starting point.
AI generates baseline forecasts from historical patterns, giving FP&A teams something grounded to work from rather than a number they have to justify from first principles.
Exception detection runs quietly in the background, but it earns its place when something unusual slips through a departmental submission.
A headcount assumption that’s well outside historical norms, for example, gets flagged before it reaches the CFO rather than after.
And for board reporting, AI drafts the narrative layer from the underlying numbers. Finance reviews and edits, and the blank page problem disappears.
Why Datarails Is the Excel-Native FP&A Platform for Modern Finance Teams
Datarails is built for finance teams that live in Excel and want to stay there.
The platform connects to existing Excel models and adds the infrastructure layer that spreadsheet-only planning lacks:
- Real-time ERP integration
- Automated version control
- Single source of truth consolidation
- AI-powered variance analysis
Finance teams don’t learn a new interface because they can still work in Excel.
Datarails handles what Excel can’t do on its own.
- Real-time ERP integration: Actuals flow into the planning model automatically as the close progresses.
- Version control: Every change is tracked, attributed, and recoverable.
- Automatic consolidated reporting across entities, cost centers, and scenarios: Multi-entity finance teams get a single view of group performance without a manual roll-up.
- AI-powered budget vs. actual analysis: Surfaces variance explanations automatically.
More than 1,000 finance teams globally use Datarails to run faster, more accurate planning cycles on the foundation of budgeting and forecasting in Excel, without changing the financial modeling tools or workflows their teams already know.
Ready to close the gap between your Excel model and real-time financial intelligence?
Budgeting and Forecasting in Excel FAQs
Budgeting and forecasting in Excel refers to building financial plans, projections, and performance-tracking models in Microsoft Excel.
Start with a dedicated assumptions tab, then build calculation logic that references those assumptions using driver-based formulas.
Next, separate your inputs, calculations, and output layers into distinct tabs. Use named ranges for readability, Power Query for data refresh, and CHOOSE() for scenario toggling.
A checks tab that flags formula errors and out-of-balance items will save a lot of time during review cycles.
The right template depends on the use case. For most FP&A teams, a rolling 12-month forecast template that separates actuals from forward assumptions, using OFFSET for dynamic date ranges, is the most practical starting point.
For fundraising or board-level analysis, a three-statement model that links the income statement, balance sheet, and cash flow statement is the standard.
A rolling forecast in Excel maintains a continuous forward-looking window, typically 12 months, that updates as each month closes. Actuals replace the forecast for completed periods, and a new future month is added to keep the window constant.
Budget vs. actual analysis in Excel compares planned financial performance against real results.
A well-built template shows the budget, actuals, dollar variance, and percentage variance for each line item, with conditional formatting that flags variances outside defined thresholds.
The practical indicators that suggest the model needs better infrastructure are:
– Three or more entities requiring consolidated reporting
– A close cycle longer than seven days with manual actuals transfer
– Multiple scenario files that are hard to keep synchronized
– A model that breaks when new cost centers or entities are added
– A finance team that spends more time maintaining models than analyzing results
Scenario planning in Excel models multiple future outcomes (typically Base, Upside, and Downside) within a single workbook.
Datarails connects to existing Excel models and adds an integration and intelligence layer on top. The platform automatically pulls actuals from ERP and accounting systems, enforces version control across the model, consolidates multi-entity data into a single view, and surfaces AI-powered variance analysis.
Finance teams continue to work in Excel. Datarails handles the data infrastructure that Excel doesn’t manage natively.