
Click for Takeaways: Strategic CVP Analysis & Planning
- C-Suite Priority Shift: 55% of CFOs have reprioritized long-term resource allocation, making CVP analysis the primary framework for setting realistic sales targets in volatile markets.
- The Trust Gap: With 40% of CFOs doubting their data accuracy, the focus has shifted toward real-time reporting to ensure break-even assumptions reflect current market pricing.
- Dynamic Break-Even: 98% of finance functions are investing in automation to move CVP from a static, quarterly spreadsheet exercise to a real-time analytical capability.
- Risk Mitigation: Three-quarters of finance leaders are using CVP to calculate the “margin of safety,” allowing them to build contingency plans for potential sales declines.
- Digital Transformation: 79% of CFOs are replacing manual data entry with integrated platforms to ensure CVP models update automatically as costs and volumes fluctuate.
Cost-volume-profit analysis or CVP analysis, also known as break-even analysis, is a financial planning tool leaders use to create effective short-term business strategies.
It conveys to business decision-makers the effects of changes in selling price, costs, and volume on profits (in the short term).
Financial planning and analysis (FP&A) leaders commonly apply CVP to break-even analysis.
Simply put, break-even analysis calculates how many sales it takes to pay for the cost of doing business to reach a break-even point (neither making nor losing money).
Let’s take a sub-tastic example of cost-volume-profit analysis in action:

Imagine you are opening a restaurant selling sub sandwiches. Through your research, you discover you can sell each sandwich for $5. But…you then need to know the variable cost.
According to McKinsey’s 2024 CFO pulse survey, 55% of CFOs now prioritize long-term planning and resource allocation, up from just 30% in 2023. This shift toward strategic planning reflects the growing complexity of financial decision-making in volatile markets. Cost-volume-profit analysis serves as a foundational tool for this strategic work, enabling finance leaders to model different scenarios and understand the relationship between costs, volume, and profitability. By conducting regular CVP analyses, FP&A teams can provide executives with the quantitative insights needed to set realistic sales targets and evaluate the financial viability of new products or market expansions.
Finding the Variable Costs
The variable cost is the cost of making the sandwich (the bread, mustard, and pickles).
This cost is known as variable because it “varies” with the number of sandwiches you make. In our case, the cost of making each sandwich (each sandwich is considered a “unit”) is $3.
Now, what is the contribution margin?
Contribution margin is the amount by which revenue exceeds the variable costs of producing that revenue.
The formula for the calculation of the contribution margin is:
CM = Sales – Variable Costs
Subtract the variable cost from the sale price ($5-the $3 in our sub example).
This gives us the contribution margin. Therefore, in the case of our sandwich business, the contribution margin is $2 per unit/sandwich.
Fixed Costs
Now, we need to know fixed costs. These costs remain constant (in total) over some relevant output range.
Fixed costs include things like rent and insurance.
Whether the sandwich shop sells 50 subs or 50,000 subs, these costs stay the same. In our sandwich business example, let’s say our fixed costs are $20,000.
The Meat of the Matter: Finding the Break-Even Point in Units (or Sandwiches)
To find out the number of units that need to be sold to break even, the fixed cost is divided by the contribution margin per unit.
Break-Even Units = Fixed Costs/Contribution Margin Per Unit
So, $20,000 fixed costs divided by our contribution margin (2000/$2) means we need to sell 10,000 sandwiches If we do not want to lose money.
Setting a Dollar Target For Breaking Even
However, we will likely need to enter a sales dollar figure (rather than the number of units sold) on the register. This involves dividing the fixed costs by the contribution margin ratio.
Break-Even Dollars = Fixed Costs/Contribution Margin Ratio
For our sub-business, the contribution margin ratio is ⅖, or 40 cents of each dollar contributes to fixed costs. With $20,000 fixed costs/divided by the contribution margin ratio (.4), we arrive at $50,000 in sales.
Therefore, we can break even if we ring up $50,000 in sales.
Difference Between CVP Analysis and Break-Even Analysis
Cost Volume Profit (CVP) analysis and break-even analysis are sometimes used interchangeably, but in reality, they differ because break-even analysis is a subset of CVP.
CVP is a comprehensive analysis that examines the relationship between sales volume, costs, and profit to determine break-even points and profit targets.
It considers various factors, such as:
- Sales price
- Costs
- Sales mix
Break-even analysis only identifies the sales volume required to break even. It is a subset of CVP analysis focused on finding a situation where total revenue equals total costs, resulting in zero profit or loss.
It helps determine the minimum sales volume needed to cover costs.
The real-world business dangers of CVP analysis

The dangers of not doing a CVP analysis are instantly clear. In a real-world example, the founder of Domino’s Pizza, Tom Managhan, faced an early problem involving poorly calculated CVP in his book “Pizza Tiger”.
The company was providing small pizzas that cost almost as much to make and just as much to deliver as larger pizzas. Because they were small, the company could not charge enough to cover its costs.
At one point, the company’s founder was so busy producing small pizzas he did not have time to determine that the company was losing money on them.
On a separate note, according to industry experts, real-time CVP analysis was crucial during COVID-19, particularly in industries such as hotels, just to keep the lights on.
Plotting the CVP Graph
The cost-volume-profit chart, often abbreviated, is a graphical representation of the cost-volume-profit analysis.
In other words, it’s a graph showing the relationship between the cost of units produced and the volume produced using fixed costs, total costs, and total sales.
It’s a clear and visual way to tell your company’s story and the effects when changing selling prices, costs, and volume.
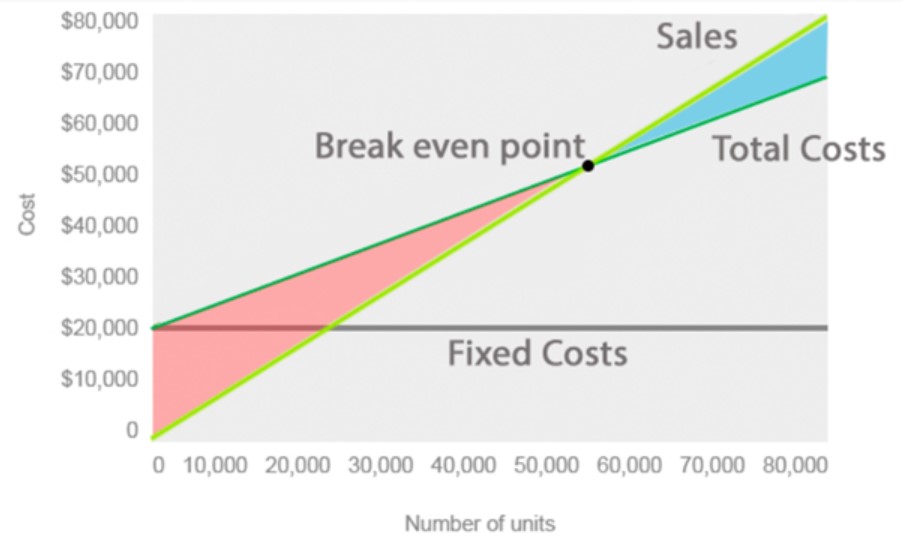
On the X-axis is “the level of activity” (for instance, the number of units). On the Y-axis, we place sales and total costs. The fixed cost remains the same regardless.
The point where the total costs line crosses the total sales line represents the break-even point. This is the point of production where sales revenue will cover production costs.
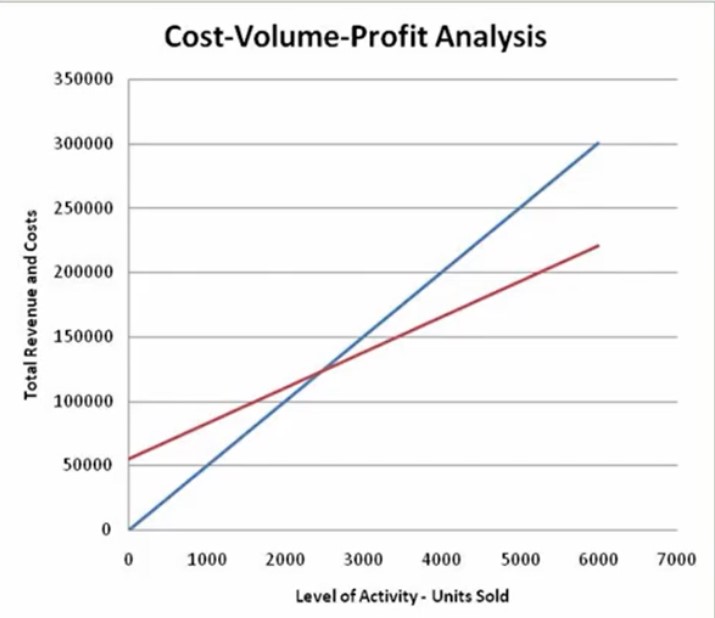
The above graph shows the break-even point is between 2000 and 3000 units sold.
For FP&A leaders, this cost accounting method can show executives the margin of safety or the risk the company is exposed to if sales volumes decline.
Gartner’s December 2024 finance survey found that three-quarters of respondents are more focused on downside risk and cost containment in their scenario planning for 2025 budgets. CVP analysis becomes particularly valuable here, as it helps finance leaders understand the “margin of safety”—the buffer between actual sales and break-even sales. By modeling multiple scenarios with different fixed and variable cost assumptions, CFOs can develop contingency plans and identify which cost drivers have the greatest impact on profitability.
For instance, the CVP can show an executive that in an economic downturn, the company is at risk of losing money on sales of this product because it has a higher level of risk due to its lower margin of safety.
In conjunction with other types of financial analysis, leaders use this to set short-term goals that will be used to achieve operating and profitability targets.
CVP Analysis Limitations
Like all analytical methodologies, CVP analysis has inherent limitations.
This includes challenges for CVP analysts when identifying what should be considered a fixed cost and what should be classified as a variable cost. Some fixed costs do not remain fixed indefinitely.
Costs that once seemed fixed, such as contractual agreements, taxes, and rents, can change over time. Further, assumptions made surrounding the treatment of semi-variable costs could be inaccurate.
Therefore, having real-time data fed in with a solution such as Datarails is paramount.
With that all said, for most, the best way to do a CVP analysis is to use Excel.
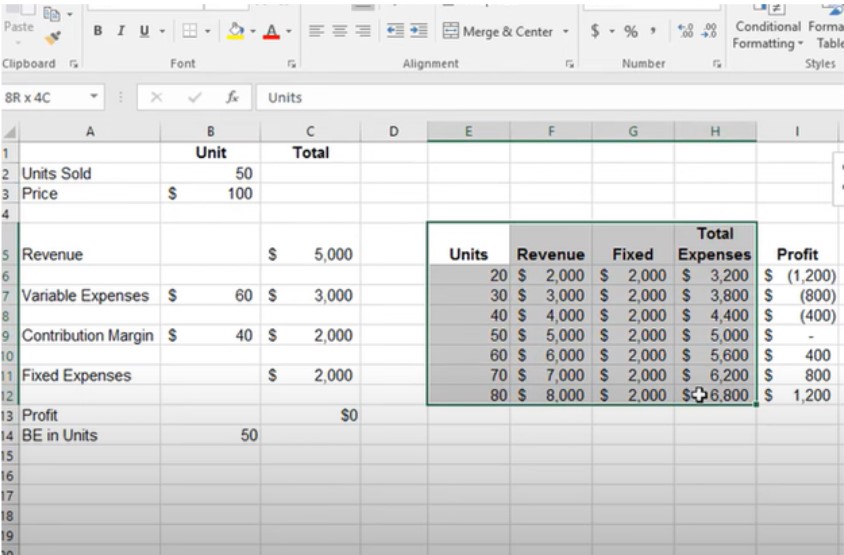
To build a chart first input the “juicy data” (price, variable expenses, contribution margin). In the “insert” tab, choose a line chart. Select the data and edit the graph appropriately to change to correct the labels.
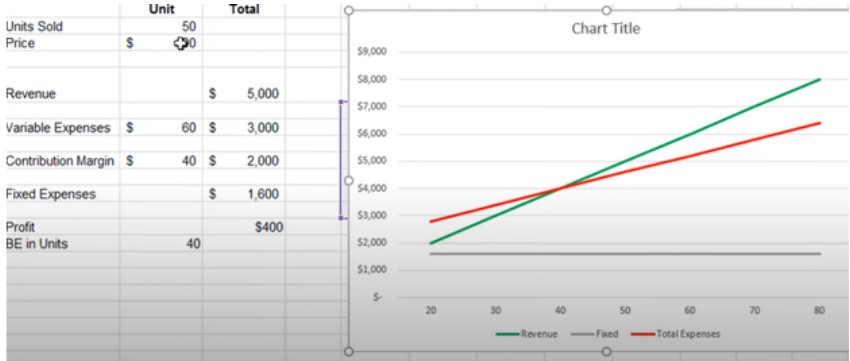
This visual line chart tells your story clearly outlining revenue, fixed costs, and total expenses, and the breakeven point.
Nearly 40% of CFOs globally do not completely trust the accuracy of their organization’s financial data, according to research from BlackLine. This data quality challenge underscores the critical need for real-time financial reporting systems that can feed accurate information into analytical models like CVP. When cost structures or pricing change, outdated assumptions can lead to poor strategic decisions. Gartner’s 2025 CFO priorities survey found that metrics, analytics, and reporting rank as the top priority for finance leaders, recognizing that timely data is essential for effective financial planning and analysis.
According to Forrester’s 2024 Automation Survey, 95% of automation decision-makers said that technology plays a critical role in their enterprise strategy. For finance specifically, McKinsey research reveals that 98% of CFOs report their functions have invested in digitization and automation. However, integration remains a hurdle. Automated solutions that integrate real-time data with analytical models enable teams to update break-even calculations instantly when variables change, transforming CVP from a periodic exercise into a dynamic FP&A software capability.
Using Datarails, a Budgeting and Forecasting Solution
Gartner’s 2024 CFO survey revealed that 79% of CFOs stated that leading digital transformation efforts is their top area of focus. This transformation extends to financial planning tools, where traditional Excel-based CVP models are being augmented with integrated platforms. These modern solutions eliminate the manual work of copying and pasting data while automatically updating variance analysis as underlying financial data changes. This shift reflects a move away from manual processes that increase error risks, particularly in complex multi-product scenarios.
CVP is a tried and tested method for businesses.
Datarails is a budgeting and forecasting solution that integrates such spreadsheets with real-time data.
It integrates fragmented workbooks and data sources into one centralized location. This lets you work in the comfort of Microsoft Excel with the support of a much more sophisticated but intuitive data management system.
Plugging into your financial reports ensures this valuable data is updated in real-time.
Everything you have built or can build in Excel is available through Datarails, which provides security and efficiency (and no more copying, formatting, and pasting).
We do the mapping and updates (normally hours of manual work), and the system automatically updates.
For instance, simple CVP analysis is automatically updated in a PDF presentation in real-time through Datarails.
CVP Analysis & Strategy FAQs
CVP analysis is a financial modeling technique that examines how changes in sales volume, costs, and pricing affect a company’s operating profit. It is a fundamental part of financial planning and analysis that maps the relationship between fixed and variable expenses.
It is critical for strategic business partnering because it provides a clear picture of a company’s profit sensitivity. It helps leaders make informed decisions on pricing, production limits, and cost-control measures.
The core components include sales price per unit, sales volume, unit variable costs, total fixed costs, and the resulting contribution margin.
The break-even point is found by dividing total fixed costs by the contribution margin per unit. This informs the team exactly how many units must be sold to cover all expenses before a profit is realized.
Businesses should utilize CVP analysis during budgeting and forecasting, when launching new products, or when evaluating the impact of a significant change in the Chart of Accounts or cost structure.
Did you learn a lot about cost-volume-profit analysis in this article?
Here are three more to read next: