Click for Takeaways: Excel Automation Tools
- Spreadsheet errors are nearly universal: 94% of business spreadsheets contain errors. Excel automation tools reduce some of this risk, but only when the data feeding those spreadsheets is accurate and governed from the source.
- Most finance teams are barely automated: 62% of finance teams automate less than one-quarter of their processes. Native Excel automation for finance handles part of the gap. Manual data collection and reconciliation still consume most of the cycle.
- Native tools automate inside Excel only: Macros, VBA, Power Query, Power Automate, and Office Scripts speed up tasks inside the spreadsheet. None of them solve the upstream problem of getting clean, current data from ERPs, CRMs, and HRIS systems into Excel without manual exports.
- AI is paying off for finance teams that commit: Among finance organizations that have adopted AI, 66% report greater efficiency and productivity as a top benefit. The gains show up fastest when AI connects directly to live financial data.
- The real bottleneck is the data layer: The difference between Excel automation tools that automate formulas and platforms that automate the full financial data pipeline is the difference between saving hours and saving days every month.
Finance teams have been automating Excel for decades because the bottleneck was never the spreadsheet itself.
Everything from macros to VBA to Power Query. Each generation made workflows faster and reports easier to build. But the work that burns the most hours happens before Excel opens, pulling actuals from NetSuite, reconciling GL data across entities, and cleaning exports that arrived in five different formats from five different systems.
We already know 94% of business spreadsheets contain errors. In most cases, the formulas are fine. The problem is the data feeding them arrives manually, inconsistently, and late.
That’s the ceiling every native Excel automation tool shares. They automate what happens after data lands in a workbook. They don’t touch the data collection, consolidation, or reconciliation upstream.
In 2026, Excel automation tools split into two categories. The first (Macros, VBA, Power Query, Power Automate, Office Scripts, Python in Excel) makes existing Excel workflows faster. The second (Excel-connected FP&A platforms) automates the operational finance layer that feeds Excel, including live ERP connections, automated financial reporting, multi-entity consolidation, and recurring close-cycle processes.
This guide covers both. Every major native tool with finance-specific framing on what it does and where it stops. And the financial analysis software platforms that pick up where native tools leave off.
What Are Some Tools That Can Automate Data Consolidation and Reporting in Excel for Financial Analysis?
Two categories of Excel data consolidation tools exist, each solving different parts of the problem.
Native Excel automation tools handle consolidation and reporting tasks inside the spreadsheet:
- Power Query: Merges and cleans data from multiple files and sources before it enters your model. Define the transformation once, refresh when new exports arrive.
- VBA and Macros: Automate repetitive formatting, calculations, and report generation inside existing workbooks. No live data connection.
- Power Automate: Triggers scheduled refreshes, report distribution, and approval workflows around Excel files. Requires IT support to configure.
- Office Scripts: Cloud-based alternative to VBA for Excel Online. Works with Power Automate for scheduled tasks.
These tools are effective, but they all require data to already be in Excel or in an accessible file. They don’t pull live data from your ERP.
FP&A platforms with Excel integration automate the full pipeline:
- Datarails: Connects to 600+ ERPs and data sources, automates multi-entity data consolidation, automatically refreshes P&L and balance sheet reports, and layers in AI for variance analysis and financial narrative generation. All inside Excel.
- Cube: Spreadsheet-native FP&A platform that syncs data from ERP, CRM, and HRIS systems into Excel and Google Sheets for centralized planning and reporting.
- Vena: Microsoft-native planning platform with Excel integration, consolidation workflows, and AI-powered Copilot for analysis and forecasting.
Native tools automate what you do with data once it’s in Excel. FP&A platforms automate getting it there, keeping it current, and turning it into automated financial reporting without manual intervention.
The table below outlines what each category of Excel automation tools covers and where they end.
| Native Excel Automation Tools | FP**&**A Platforms with Excel Integration | |
| What it automates | Formulas, formatting, data transformation, report generation, workflow triggers | Data collection, consolidation, report refresh, close-cycle reporting, variance analysis |
| What it cannot automate | Data sourcing from ERPs, live refresh, multi-entity consolidation, intercompany eliminations | Already handles end-to-end; limited by integration depth per vendor |
| ERP connectivity | None natively. Requires manual exports or IT-managed connectors | Direct integrations (600+ for Datarails; varies by platform) |
| Multi-entity consolidation | Manual. Requires custom VBA or Power Query logic per entity | Automated mapping, currency conversion, intercompany eliminations |
| Live data refresh | No. Depends on manual file updates or scheduled Power Automate flows | Yes. Pulls from source systems on schedule or on demand |
| AI-driven analysis | Python in Excel supports statistical modeling (requires data science skills) | Built-in AI for variance analysis, narrative generation, anomaly detection (varies by platform) |
| Time to implement | Minutes to hours per tool | 2-6 weeks (Datarails), 3-12 months (enterprise platforms) |
| Best for | Individual tasks, stable templates, teams with technical Excel skills | Recurring finance workflows, multi-entity orgs, teams that need the data layer automated |
Native Excel Automation Tools Every Finance Team Should Know
Six native tools handle most automations inside Excel, each one solving a specific problem. But none of them solve all of them.
Here’s what each tool actually does for finance teams, where it hits its ceiling, and when it’s the right choice.
Macros
Macros are recorded sequences of actions inside Excel. No coding required. You perform a task once, record it, and replay it on demand.
Finance teams use Macros to standardize recurring formatting tasks: applying close-package layouts, reformatting GL exports into board-ready reports, or resetting templates at the start of each period. One click replaces 20 minutes of manual formatting.
The ceiling is low. Macros only work on data already in the workbook. They break when file structures change (new columns, renamed tabs, shifted ranges). And they can’t pull data from external systems.
Best for: Repetitive formatting tasks on stable templates where the workbook structure doesn’t change month to month
VBA (Visual Basic for Applications)
VBA is the programming language built into Excel. It handles custom logic that Macros can’t, including loops, conditional branching, error handling, and multi-step calculations across worksheets.
Finance teams use VBA automation for finance workflows like consolidating trial balances from multiple worksheets, running intercompany eliminations, or generating multi-tab report packages with conditional formatting based on variance thresholds. A well-built VBA script can turn a half-day manual process into a 30-second run.
The ceiling is maintenance. VBA scripts are fragile. They break when file structures change, when someone renames a sheet, or when a new entity gets added. They require coding knowledge to build and update. And when the person who wrote the script leaves the team, the automation often leaves with them.
Best for: Custom logic automation when you have in-house Excel expertise and stable file structures
Power Query
Power Query is Excel’s built-in ETL (extract, transform, load) engine. It merges, cleans, and reshapes data from multiple files and some external sources before it enters your model.
For finance teams, Power Query for finance workflows is where data analysis tools in Excel start to get serious. Use it to combine monthly CSV exports from multiple ERPs, map disparate charts of accounts into a unified structure, or clean and standardize GL data across subsidiaries before account reconciliation.
The ceiling is connectivity. Power Query works on static file exports, not live ERP connections. Every time source data updates, someone still has to download the export and drop it in the right folder. Transformation logic also needs manual maintenance when source formats change. And Power Query doesn’t handle workflow automation (scheduling, approvals, distribution).
Best for: Teams that consolidate data from file exports and need repeatable cleanup and transformation logic
Power Automate
Power Automate is Microsoft’s cloud-based Excel workflow automation platform. It connects to 1,000+ services and triggers actions based on schedules, events, or conditions.
Finance teams use it to schedule report refreshes, auto-email close packages to stakeholders, route budget approval requests, or move files between SharePoint and Excel automatically. A typical flow might refresh a shared Excel report every Monday morning and email the PDF to the CFO before the weekly meeting.
The ceiling is ownership. Power Automate requires IT involvement to set up and maintain. Finance teams rarely own this tool. Connectors to ERPs are shallow (metadata and basic record access, not full GL data pulls). And it’s a workflow layer, not a financial modeling or consolidation tool.
Best for: Automating distribution and approval workflows around existing Excel reports, with IT support for setup and maintenance
Office Scripts
Office Scripts is Microsoft’s TypeScript-based scripting language for Excel Online. Think of it as VBA’s cloud-native successor, designed to work with Power Automate for scheduled, automated runs.
Finance teams working in Excel Online use Office Scripts to automate formatting, data manipulation, and light transformation tasks in shared workbooks. Combined with Power Automate, a script can fire every time a new row hits a shared workbook or on a set schedule.
The ceiling is ecosystem. Office Scripts only works in Excel Online, not the desktop app. The community and library of existing scripts is much smaller than VBA’s. Adoption in finance is still limited.
Best for: Teams already working in Excel Online who want cloud-based automation that pairs with Power Automate
Python in Excel
Python in Excel brings Python’s data science libraries (pandas, matplotlib, scikit-learn) directly into Excel cells. Calculations run in the cloud via Microsoft’s secure runtime.
Finance teams with data science skills use it for Monte Carlo simulations, regression analysis, sensitivity modeling, and advanced forecasting that goes beyond what Excel formulas can handle natively. You can also access AI plugins for Excel and machine learning libraries without leaving the spreadsheet.
The ceiling is accessibility and scope. Python in Excel requires Python skills most finance teams don’t have. Compute runs in the cloud, which adds latency. And it’s an analytics tool, not an automation layer for recurring workflows. It won’t refresh your reports, pull your ERP data, or run your consolidation.
Best for: Finance teams with data science skills who need advanced statistical modeling inside Excel
The Native Tool Ceiling
Every native Excel automation tool shares the same structural limit. They automate what happens inside Excel. They still depend on finance teams to maintain exports, transformation logic, workbook structures, and reporting pipelines manually.
62% of finance teams automate less than one-quarter of their processes. That gap doesn’t close by stacking more native tools on top of each other. As organizations grow, the operational burden of maintaining these automations becomes the bottleneck itself, especially during close cycles and multi-entity reporting.
For finance teams whose constraint is data collection, consolidation, or recurring report generation, no combination of native tools fixes the problem. That’s what the next category exists to solve.
FP&A Platforms That Automate the Data Layer Feeding Excel
The tools above automate inside Excel. The platforms below automate the data layer that feeds it, including live ERP connections, recurring consolidation, report generation, and AI-driven analysis.
The shift is already underway. Gartner predicts 90% of finance functions will deploy at least one AI-enabled technology by 2026. And among finance organizations that have already adopted AI, 66% report greater efficiency and productivity as a top benefit. The gains are real, but they depend on the platform connecting directly to live financial data rather than layering AI on top of static spreadsheets.
Here are six platforms that connect to Excel for financial dashboard creation, AI-driven FP&A, and automated financial reporting.
1. Datarails
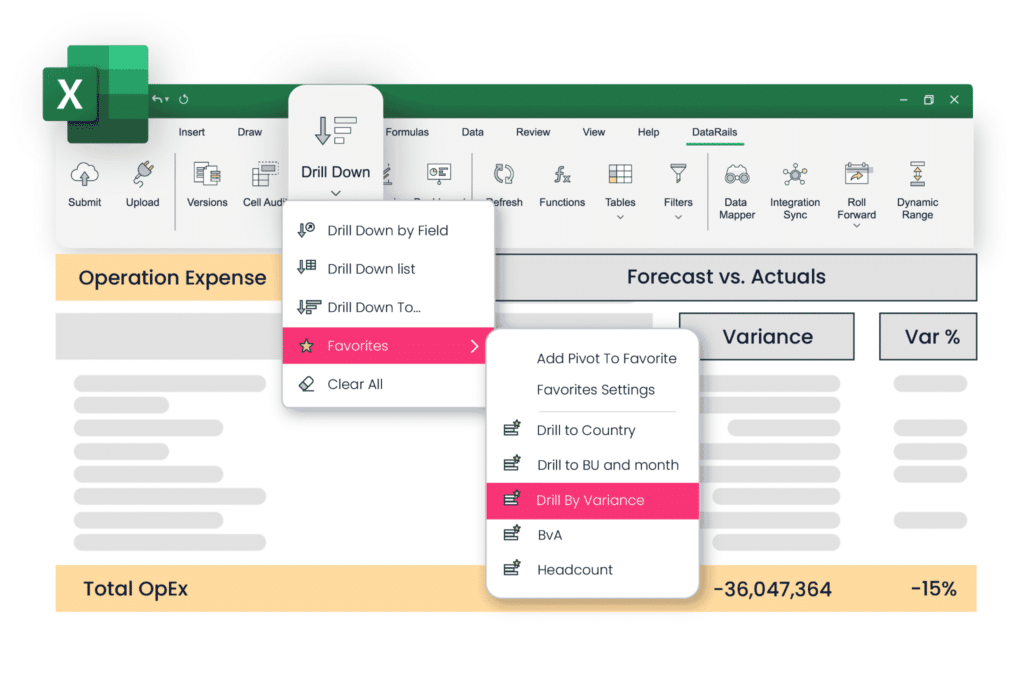
Datarails is an FP&A automation platform built for finance teams that live in Excel. It connects to 600+ ERPs and data sources, automatically pulls actuals, and consolidates financial data across entities without requiring teams to leave their existing spreadsheets or rebuild their models.
Where native Excel automation tools stop at the workbook’s edge, Datarails automates the full operational layer. Multi-entity consolidation runs automatically with intercompany eliminations, currency conversion, and a full audit trail. P&L, balance sheet, and cash flow reports refresh on schedule or on demand. Month-end close cycles that used to take a week compress into hours.
“At the click of a button, my financial statements are ready. From over a week to minutes.” Megan Hedderson, Controller, Spencer & Butcher
Datarails also layers AI directly on top of live financial data. FP&A Genius lets anyone on the finance team ask natural-language questions about variances, trends, and drivers without building a new report. AI-generated financial narratives and automated commentary reduce the manual work of explaining the numbers, not just producing them.
“Without Datarails, I would’ve needed to double my current team of three just to produce what we’re delivering today.” Steven Carkey, VP Finance Operations, Butternut Box
Implementation is fast. FP&A capabilities go live in 4-6 weeks. Financial statement automation in as few as 2 weeks without the need for consultants.
Best for: Mid-market finance teams (50-500 employees) that work in Excel and need automated consolidation, reporting, and close-cycle workflows without disrupting existing models. Pricing starts at approximately $24K/year (contact Datarails for current pricing)
2. Vena Solutions
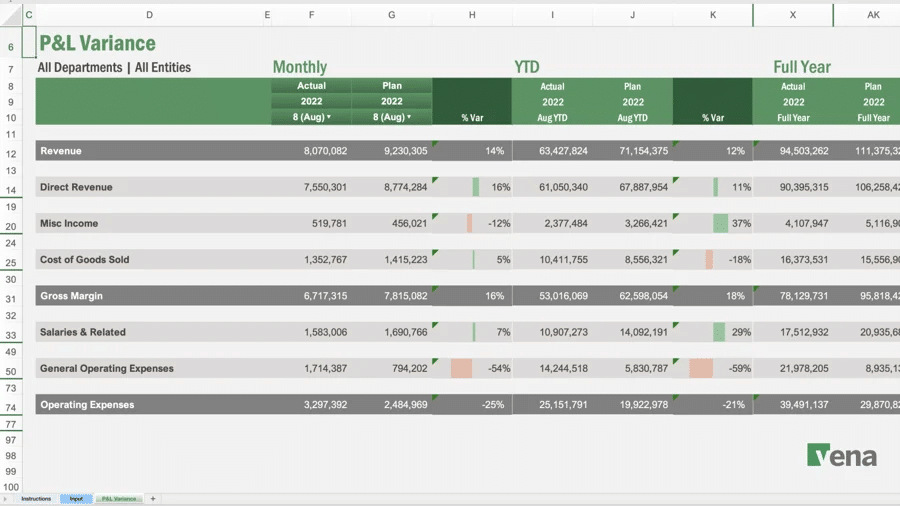
Vena is a Microsoft-native planning platform that integrates with Excel, Power BI, Azure, and Fabric. It recently completed its acquisition of Acterys (March 2026), expanding its capabilities into operational planning and Power BI-based analytics. Vena now positions itself as an “Orchestrated Performance Management” platform with 3,000+ customers and nearly $200M in ARR.
Finance teams working entirely within the Microsoft ecosystem get deep integration and a familiar Excel interface backed by Vena’s CubeFLEX database. The platform handles budgeting and forecasting, consolidation, close management, and AI-powered analysis through Vena Copilot. The tradeoff is complexity. Initial setup is involved, custom pricing makes comparison difficult, and teams outside the Microsoft ecosystem will find less value here.
Best for: Microsoft-centric mid-market to enterprise organizations that need planning, consolidation, and close in one platform. Pricing is custom, with first-year mid-market TCO typically costing $75K-$250K+
3. Cube
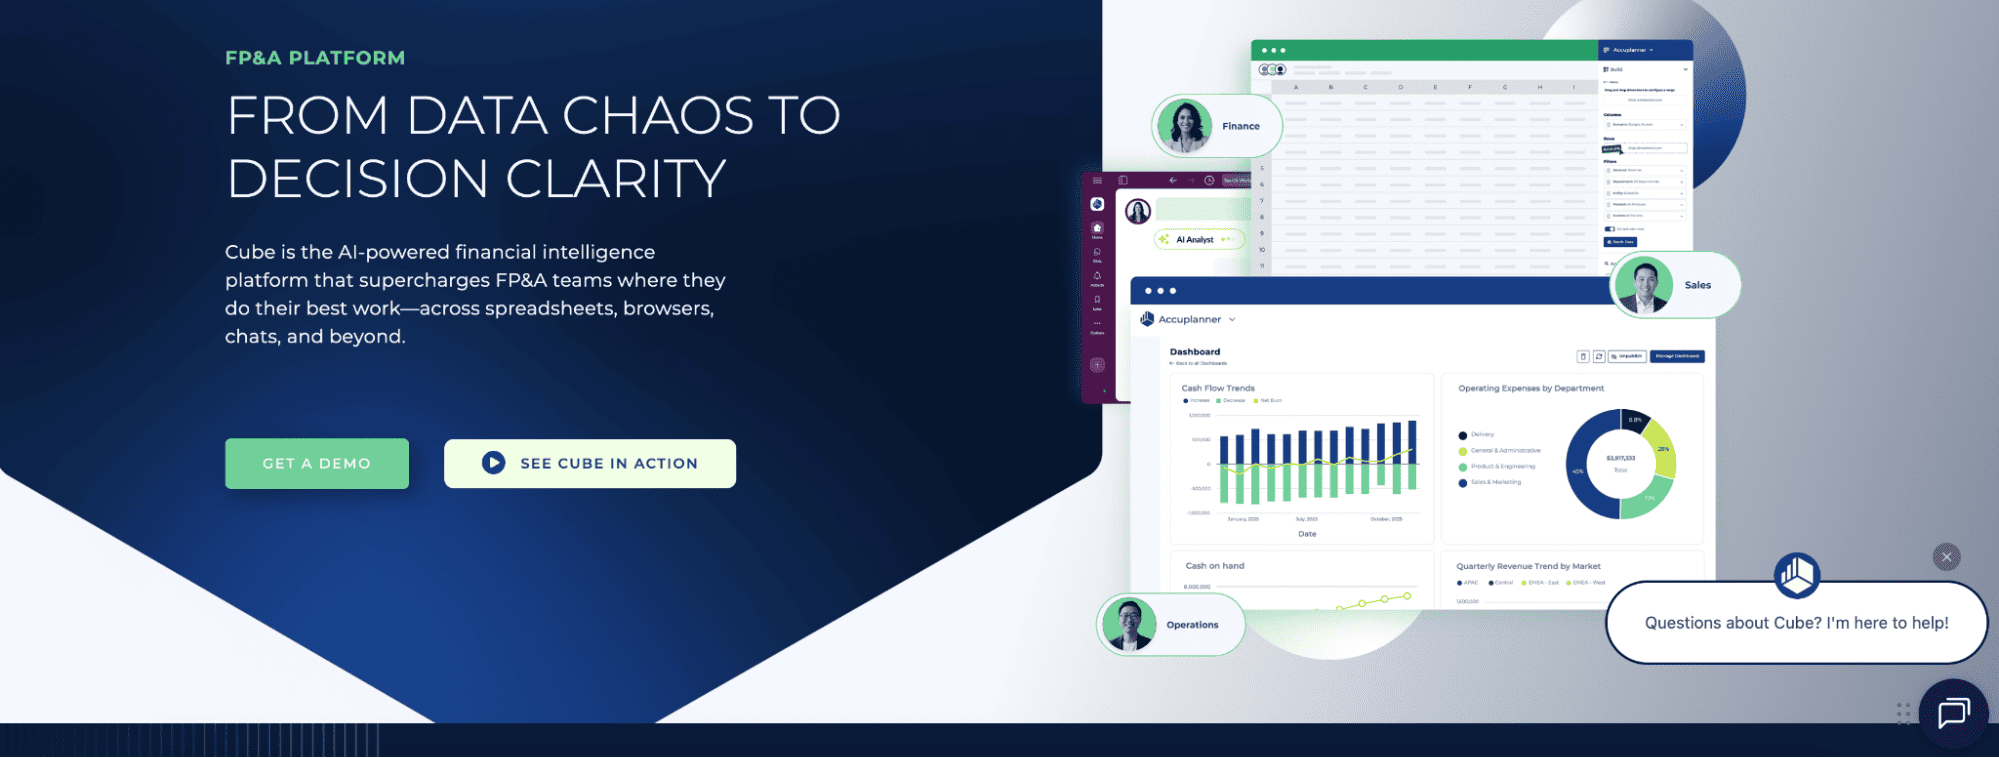
Cube is a spreadsheet-native FP&A platform that works with both Excel and Google Sheets. It syncs data from ERP, CRM, and HRIS systems into your spreadsheets for centralized planning, reporting, and analysis. G2 users rate it 4.8/5 for ease of use.
Cube’s strength is speed and simplicity. Implementation is fast, the learning curve is shallow, and teams that split between Excel and Google Sheets get coverage on both sides. The tradeoff is depth. Multi-entity consolidation capabilities are limited compared to Datarails or Vena, some ERP connections (notably NetSuite) have required manual uploads, and headcount planning is not available as a built-in module.
Best for: Small- to mid-market teams seeking lightweight FP&A without extensive implementation. Pricing is custom, ranging from $15K-$45K+/year
4. Coefficient
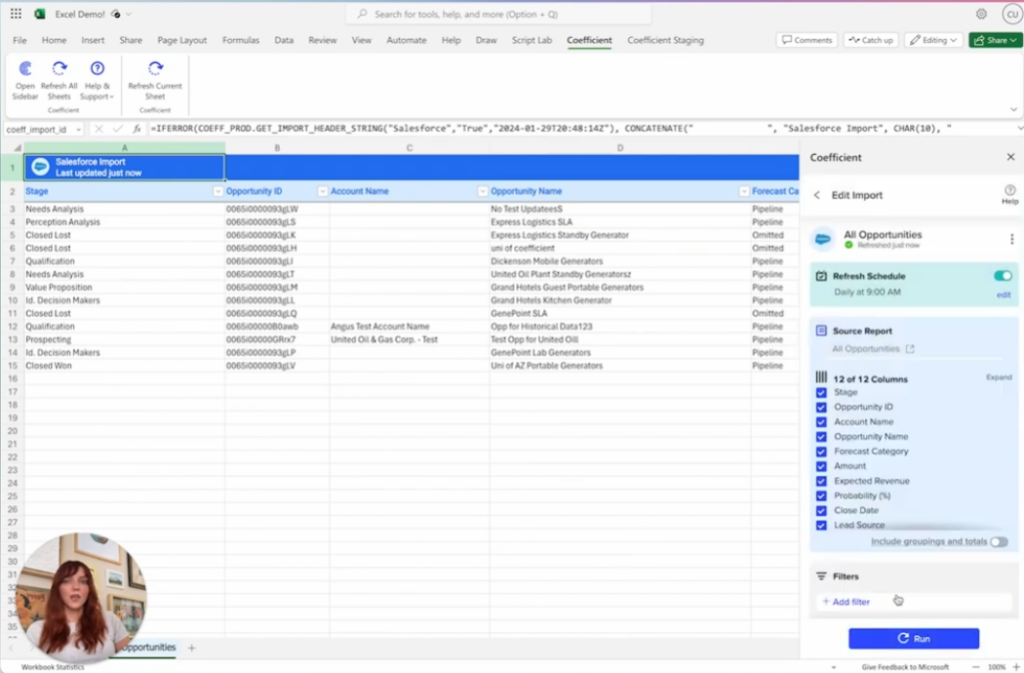
Coefficient is a data connector that syncs live data from 100+ business systems into Google Sheets and Excel. It handles automated imports, scheduled refreshes, two-way data sync, and alert triggers based on cell values or conditions.
Coefficient is useful for operational dashboards, revenue reporting, and live KPI tracking directly in spreadsheets. The free tier makes it accessible for smaller teams. But Coefficient is a data pipe, not an FP&A platform. It doesn’t offer budgeting, forecasting, consolidation, or financial close capabilities. Finance teams that need more than live data sync will outgrow it quickly.
Best for: Operational dashboards and live data sync for teams that need real-time spreadsheet reporting from SaaS tools. Pricing varies. A free plan is available, the Starter plan costs $59/month, and Pro $99/user/month.
5. Planful
Planful is a cloud-based FP&A platform focused on financial consolidation, close management, and continuous planning.
Planful hits a sweet spot for upper mid-market organizations where consolidated financial statements and close acceleration are the primary pain points. Driver-based planning, rolling forecasts, and Predict Signals (AI-powered anomaly detection) round out the feature set.
The tradeoff is accessibility. Planful has a steep learning curve, complex initial setup, and is not truly Excel-connected. Finance teams model inside Planful’s interface and export to Excel for distribution, which means rebuilding existing Excel models during implementation.
Best for: Upper mid-market to enterprise organizations ($100M-$2B revenue) focused on consolidation and close management. Pricing is custom, typically ranging from $200K-$500K+/year.
6. Workday Adaptive Planning
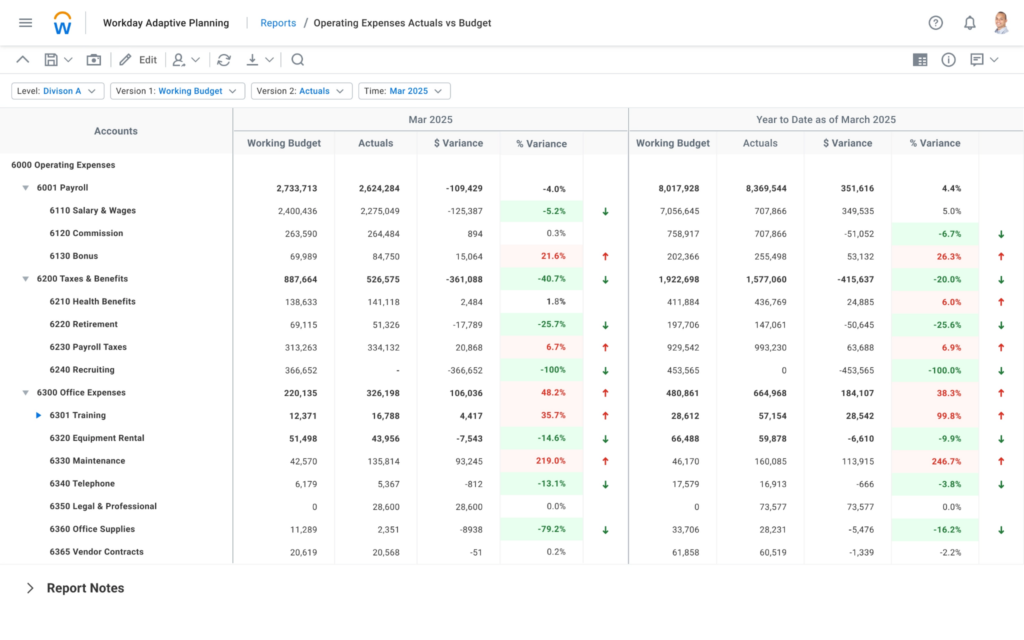
Workday Adaptive Planning is an enterprise FP&A platform with 6,300+ customers. Part of the Workday suite, it offers unlimited scenario analysis, machine learning-powered forecasting, and deep integration with Workday HCM and Financials.
For organizations already in the Workday ecosystem, Adaptive Planning removes data pipeline friction between HR, finance, and operations. The scale is massive, and ML-driven forecasting capabilities are among the most advanced in the market. The tradeoff is weight. Implementation runs 4-12 months. The Excel add-in (OfficeConnect) is primarily a reporting tool, not a native modeling interface. Smaller organizations or teams that need Excel-connected planning will find it over-engineered for their needs.
Best for: Enterprise organizations ($500M+) in the Workday ecosystem that need cross-functional planning at scale. Pricing is approximately $20-40/employee/year, while implementation costs typically 100-150% of annual subscription.
How to Choose the Right Excel Automation Tool
The right Excel automation tool depends on where your bottleneck actually sits. Use these workflow problems to determine which one is the best fit for your needs.
- “I want to stop manually reformatting the same report every month”: Macros. Record the formatting sequence once, run it on every close cycle without any coding.
- “I need custom logic in my automation, like loops, conditions, or branching”: VBA. More powerful than Macros, but requires coding knowledge and stable file structures to maintain.
- “I need to merge and clean data exports from multiple sources before modeling”: Power Query. Define the transformation once, then refresh it when new exports arrive. Works best with static file exports.
- “I want reports to email automatically and approval workflows to run without chasing people”: Power Automate with IT support. It builds scheduling, distribution, and approval flows around existing Excel reports.
- “I need advanced statistical modeling inside Excel without switching tools”: Python in Excel, if your team has the data science skills to use it.
- “I need my Excel models to refresh automatically from our ERP without manual exports”: FP&A platform with live ERP integration. Datarails, Cube, or Vena depending on scale and ecosystem. This is where native Excel automation for finance hits its ceiling and financial reporting software takes over.
- “I need multi-entity consolidation without building a new mapping spreadsheet every month”: Datarails is the most Excel-connected automated consolidation in this category, with intercompany eliminations and audit trail built in.
- “I need AI to surface variances and generate the financial narrative automatically”: Datarails’ AI connects directly to live ERP data and reduces recurring manual reporting through automated commentary, drill-down capabilities, and a complete month-end close checklist workflow.
- “I need a live data connection from Excel to our SaaS tools for operational dashboards”: Coefficient brings a data connectivity layer, with 100+ integrations and two-way sync. However, it’s not a full FP&A automation platform, but is strong for real-time operational reporting.
The Bottom Line on Excel Automation Tools
Native Excel automation tools solve inside-Excel problems. Macros, VBA, Power Query, Power Automate, Office Scripts, and Python in Excel each handle a specific piece of the workflow. They’re worth learning. They’re worth using.
But they share a ceiling. None of them automate data collection from ERPs. None of them run multi-entity consolidation automatically. None of them refresh your reports from live financial data without a manual export somewhere in the chain.
For finance teams whose bottleneck is upstream of Excel, FP&A platforms close the gap. Datarails does it without asking teams to leave the spreadsheets they already know.
Most finance teams are past the point of asking whether Excel should be automated. The harder question is whether automation stays in the workbook or extends across the financial data pipeline behind it.
Datarails connects to your ERP, consolidates your financial data, and automatically refreshes your Excel reports without rebuilding models, manual exports, or consultants.
Ready to see it in action?
Excel Automation Tools FAQs
The best Excel automation tools for finance teams depend on the workflow. Macros and VBA handle formatting and custom logic inside Excel. Power Query merges and cleans data from file exports. Power Automate schedules report distribution. For automation that extends beyond the workbook to live ERP data, consolidation, and reporting, FP&A platforms like Datarails, Vena, and Cube connect Excel to the data layer directly.
Native tools like Power Query and VBA can automate Excel reports within the spreadsheet. For Excel data consolidation from ERPs and other source systems, FP&A platforms handle the full pipeline. Datarails pulls from 600+ data sources, automates multi-entity consolidation, and refreshes P&L and balance sheet reports inside Excel without manual exports.
Power Query for finance merges and transforms data from static file exports. You define the cleanup logic once and refresh when new files arrive. An FP&A platform like Datarails connects directly to live ERP data, automates the pull on a schedule, handles multi-entity mapping and intercompany eliminations, and refreshes reports automatically. Power Query requires someone to download the export first. An FP&A platform removes that step entirely.
VBA automation for finance can generate reports, run calculations, and apply conditional formatting across worksheets. It’s powerful for custom logic. But VBA can’t pull live data from ERPs, run multi-entity consolidation, or schedule report refreshes without external help. For automated financial reporting that includes data sourcing and consolidation, you need an FP&A platform or a combination of VBA with Power Automate and IT support.
Native Excel tools can’t connect directly to most ERPs for live data refresh. Power Automate can trigger scheduled actions, but its ERP connectors are shallow. To automate Excel reports with live ERP data, you need an FP&A platform with direct integrations. Datarails connects to 600+ ERPs, pulls actuals automatically, and refreshes your existing Excel reports on schedule or on demand. Explore more AI tools for Excel that extend automation beyond native capabilities.
No native Excel automation tool handles multi-entity consolidation reliably at scale. VBA and Power Query can be configured for basic consolidation, but they require manual maintenance as entities change and don’t natively support intercompany eliminations or currency conversion. FP&A platforms like Datarails automate multi-entity consolidation with automated mapping, intercompany eliminations, currency conversion, and a full audit trail, all inside Excel.