![The Best Financial Analysis Software in 2026 [Ultimate Guide]](https://www.datarails.com/wp-content/uploads/2026/04/treasury-automation-1200x473.jpg)
Click for Takeaways: Financial Analysis Software Guide
- Spreadsheets alone can’t keep up: 96% of FP&A professionals still use spreadsheets for planning, but most finance organizations now pair spreadsheets with modern platforms.
- AI adoption is widespread but underdelivering: 59% of finance teams now use AI, but 91% report low impact, with data quality and availability cited as the top obstacle
- AI skills are now table stakes: One in three finance job postings now requires AI or machine learning skills, up from one in four a year ago, with FP&A roles hitting 43%
- The future is real-time and autonomous: By 2028, 70% of finance functions will use AI for real-time decision making, and agentic AI will handle at least 15% of daily decisions autonomously
- FP&A teams are already using AI daily: 26% of FP&A professionals use AI regularly, and 55% are experimenting, signaling a rapid shift from manual to AI-assisted financial analysis
Your CFO wants a reforecast by Friday, but your team just spent two weeks closing the books.
The gap between how fast the business moves and how long financial analysis takes is the core problem. Finance teams spend most of their time pulling data from disconnected systems and reconciling numbers, not analyzing them.
Modern financial analysis software addresses this by using live data environments that update automatically, flag anomalies early, and model scenarios in minutes rather than days.
This guide covers what the category does, how AI is changing it in 2026, and profiles 14 platforms, including features, pricing, pros, and cons, so you can find the right fit for your team.
Why Finance Teams Need Financial Analysis Software
Excel isn’t the problem. It’s everything that happens before the analysis starts.
96% of FP&A professionals use spreadsheets for planning, and for good reason. Excel is flexible, familiar, and powerful in the right hands. But pulling data from the ERP, reconciling it against the CRM and HRIS, and manually rebuilding models every month? That’s where finance teams lose their time.
The bottleneck isn’t the analysis itself, but rather the three things that come before it:
- Data collection is manual: Financial data lives across disconnected systems. FP&A teams spend more time gathering and reconciling numbers than actually working with them.
- Models are static. Every new forecast means rebuilding from scratch. Assumptions go stale. Version control breaks down. By the time the numbers are ready, the business has already moved on.
- Insight is delayed: Leadership needs answers now, not at the end of a two-week close cycle. When financial analysis can’t keep pace with the business, decisions get made without it.
Most finance organizations are already pairing spreadsheets with modern platforms rather than relying on them solo. The goal isn’t to replace Excel it’s to remove the manual work around it
That’s what financial analysis software does. It automates data consolidation, keeps models connected to live data, and gives finance teams the time back for the strategic work Excel was built for.
Core Capabilities of Financial Analysis Software
Not every tool in this category does the same thing. But the best financial analysis software shares a core set of capabilities that separate it from spreadsheets-only workflows.
Here are a few core capabilities to look for:
- Automated data consolidation: The foundation. Financial analysis tools pull data from ERP, CRM, HRIS, and billing systems into one place automatically. No more copying between tabs or reconciling across files. One source of truth, updated in real time.
- Real-time dashboards and KPI monitoring: Instead of building static reports, finance teams track performance as it happens. Financial dashboard software gives leadership direct access to the metrics they care about, without waiting on FP&A to build a deck.
- Variance analysis with root-cause flagging: Good financial data analysis tools don’t just show you the variance. They help explain it. Automated variance analysis flags the drivers behind budget-to-actual gaps so teams can focus on action, not investigation.
- Scenario modeling and what-if analysis: What happens to the P&L if revenue misses by 8%? What if headcount grows faster than planned? Scenario planning lets finance model multiple outcomes in minutes, rather than rebuilding spreadsheets for each one.
- AI-powered forecasting and anomaly detection: The newer generation of financial analytics software uses AI to surface trends, flag outliers, and generate forecasts based on historical patterns, moving finance from descriptive reporting to predictive analytics.
- Collaborative reporting with role-based access: Financial reporting software built for teams, not individuals. Multiple users can work in the same environment with controlled permissions, audit trails, and approval workflows.
- Excel integration: For teams that don’t want to abandon their existing models, and most don’t, the right financial analysis platform works with Excel, not against it.
Key Use Cases for Financial Analysis Software
Features matter, but what finance teams really want to know is: what can I actually do with this?
Here’s how financial analyst tools show up in day-to-day finance workflows.
Monthly Close Acceleration
The close is where most finance teams lose the most time. Financial analysis software automates data collection, reconciliation, and reporting, so teams can close faster and shift their focus to explaining results rather than compiling them.
Board Reporting and CFO-Ready Decks
Building board decks shouldn’t take a week. With real-time dashboards and financial forecasting tools, FP&A teams can pull live data into presentation-ready formats without starting from scratch every quarter.
Revenue and Cash Flow Forecasting
Static forecasts go stale fast. Modern finance analysis software keeps forecasts connected to live actuals, so teams can update projections as conditions change rather than waiting for the next planning cycle.
Headcount and OpEx Planning
People costs are usually the biggest line item on the P&L. Financial data analysis software connects HRIS data with financial models so teams can plan headcount, model compensation scenarios, and track spend against budget in one place.
Multi-Entity Consolidation
Companies with multiple entities, currencies, or business units need a clean rollup. Financial dashboard software with built-in consolidation eliminates manual intercompany work and gives leadership a unified view of performance.
Ad Hoc Analysis for Business Partners
Sales wants a margin breakdown by region. Ops wants to know the cost impact of a new warehouse. Financial analysis tools with self-serve access let business leaders pull the data they need without bottlenecking FP&A for every request.
How AI Is Changing Financial Analysis in 2026
AI in finance isn’t new, but 2026 is the year it’s becoming operational.
Gartner’s AI in Finance Survey found that 59% of finance teams now use AI, up from 58% in 2024. But here’s the problem: 91% report low impact. The bottleneck isn’t the AI itself. It’s data quality and availability. Without clean, consolidated, governed data underneath, AI tools produce outputs that finance teams can’t trust.
That’s starting to change. In our State of AI in FP&A 2025 report, we found that 26% of FP&A professionals now use AI regularly, and 55% are experimenting. The shift from “interesting” to “integrated” is happening fast.
Here’s what that looks like in practice:
From Periodic to Continuous
The monthly close as the primary reporting cadence is fading. AI financial analysis enables continuous monitoring, so finance teams spot issues in real time rather than discovering them weeks later.
From Descriptive to Predictive
Traditional reporting tells you what happened. AI finance tools tell you what’s likely to happen next. Pattern recognition, trend detection, and forecasting models give FP&A teams a forward-looking view that static reports can’t match.
From Reactive to Proactive
Anomaly detection flags variances before they become crises. Instead of explaining a miss after the board meeting, finance teams catch it early enough to course-correct.
From Static to Adaptive
Financial models that update themselves as actuals flow in. No more rebuilding a rolling forecast from scratch every month. The model stays current because the data feeding it stays current.
From Gatekeeper to Enabler
Self-serve analytics give business leaders direct access to financial data without bottlenecking FP&A for every question. AI in FP&A frees the finance team to focus on strategic analysis instead of fielding ad hoc requests.
The talent side is shifting, too. Datarails research shows that one in three finance job postings now requires AI or machine learning skills, up from one in four a year ago. For FP&A roles specifically, that number hits 43%.
And Gartner predicts that by 2028, 70% of finance functions will use AI for real-time decision making, with agentic AI handling at least 15% of daily decisions autonomously.
The message for finance leaders is simple: AI-powered financial analysis software is no longer optional. The teams that adopt it now will set the pace. The ones that wait will spend the next five years catching up.
Top Financial Analysis Software & Platforms (2026)
The following tools reflect where financial analysis software stands in 2026, from traditional FP&A software to more modern, data-driven solutions.
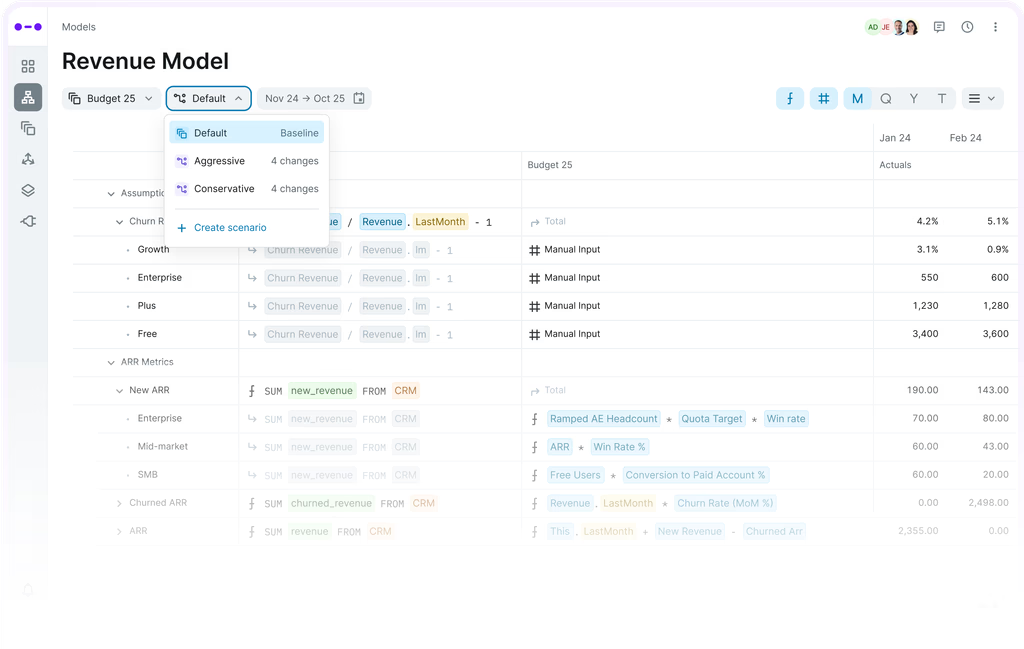
1. Datarails
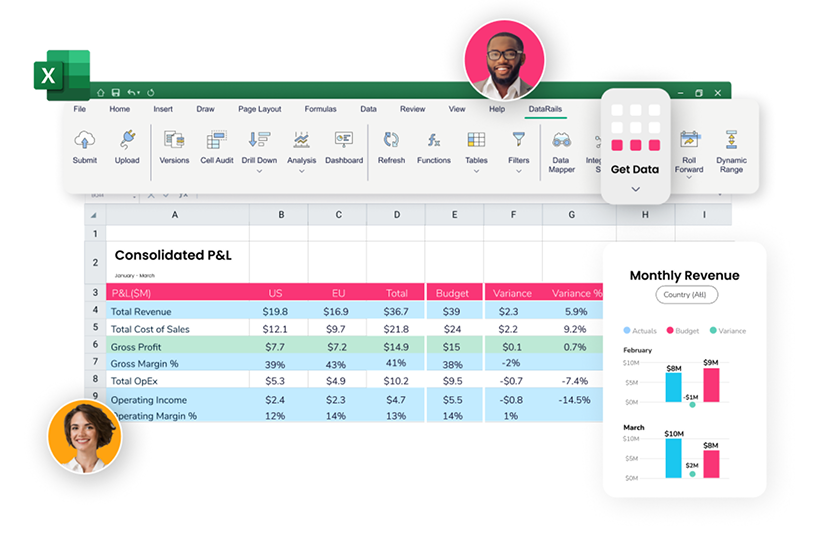
Datarails is an AI-native financial analysis platform built for finance teams that run on Excel. It consolidates data from 400+ sources (ERP, CRM, HRIS, billing) into a single source of truth, then layers in AI-powered forecasting, variance analysis, dashboards, and collaborative reporting. The platform recently launched FinanceOS, a governed data layer that lets teams use external AI engines like Claude, ChatGPT, and Copilot on top of live financial data with full audit trails.
Key features include automated data consolidation, real-time dashboards, scenario modeling, anomaly detection, and AI for financial modeling agents that generate board-ready reports from live data. It integrates natively with Excel, so teams keep working the way they already do.
Best for: SMB and mid-market finance teams (typically $10M–$500M revenue) that want to modernize FP&A without abandoning Excel. Pricing is available on request.
Pros
- Full Excel-native integration with no workflow disruption
- 200+ integrations including NetSuite, SAP, Sage, QuickBooks, and Salesforce
- Fast implementation: FP&A in 4–6 weeks, financial statements module in 2 weeks
- AI agents that generate board-ready reports from live, governed data
- Rated 4.6/5 on G2
Cons
- Windows-only Excel add-in with limited Mac support
- No Google Sheets integration
- Best suited for SMB/mid-market; complex multi-subsidiary enterprises may need additional configuration
2. Anaplan
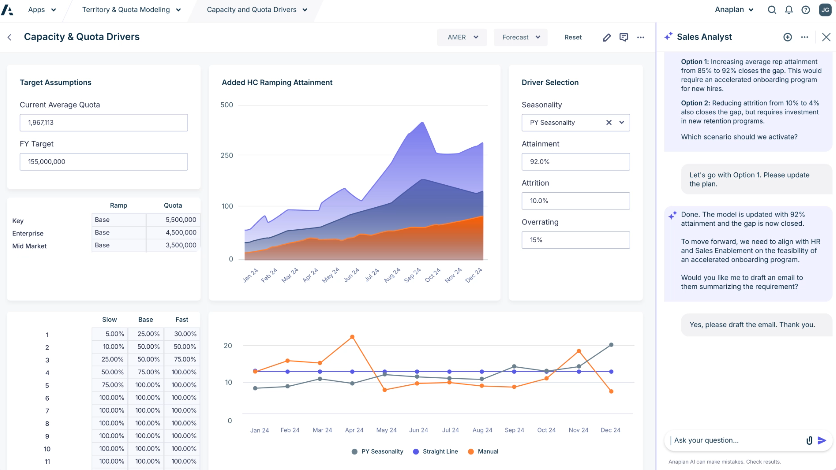
Anaplan is an enterprise-grade planning platform built on its proprietary Hyperblock calculation engine. It supports multi-dimensional financial analysis, scenario modeling, and what-if analysis across finance, sales, supply chain, and workforce planning in a single connected environment.
Features include real-time data updates, multi-user collaboration, predictive forecasting, and custom modeling logic that can handle complex driver-based plans. Recognized as a Leader in the Gartner Magic Quadrant for Financial Planning Software for three consecutive years.
Best for: Large enterprises ($500M+ revenue) with complex, cross-functional planning needs. Pricing is custom and typically starts at six figures annually.
Pros
- Powerful multi-dimensional modeling engine
- Connects financial, sales, supply chain, and workforce planning
- Strong cross-functional collaboration features
- Gartner Magic Quadrant Leader
Cons
- Steep learning curve; requires dedicated admin or consultant support
- High cost; not practical for SMBs
- Implementation can take months
3. Workday Adaptive Planning
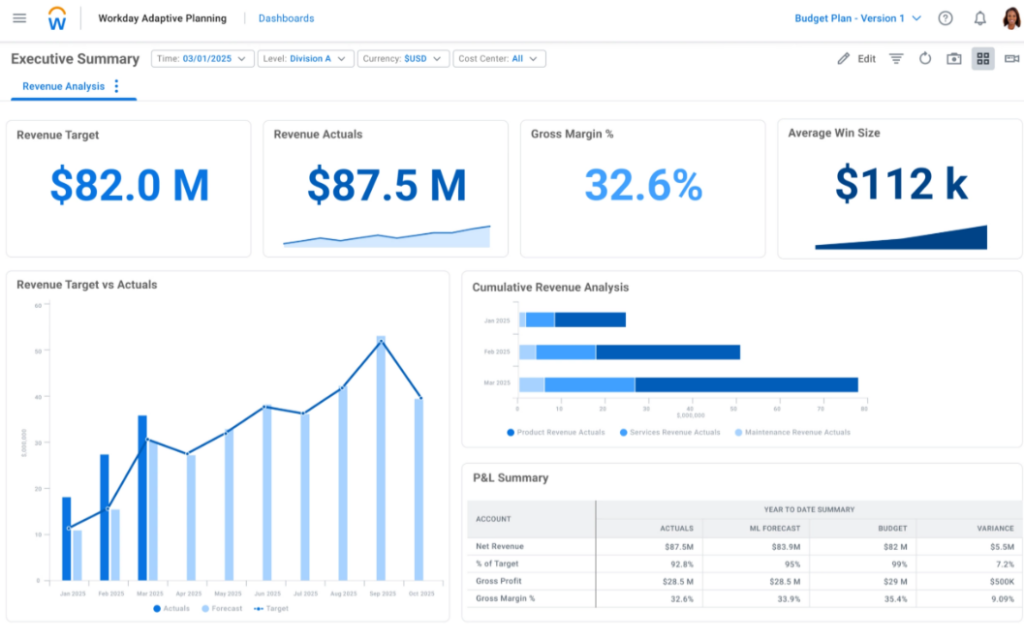
Workday Adaptive Planning is a cloud-based FP&A software platform focused on budgeting, forecasting, and reporting. It uses an in-memory calculation engine for fast modeling and integrates natively with Workday HCM and Financials. Features include driver-based planning, rolling forecasts, interactive dashboards, version control, and workforce planning tied directly to HR data.
Best for: Mid-market to enterprise companies already in the Workday ecosystem. Pricing is custom, typically mid-five to six figures annually.
Pros
- Strong what-if modeling and driver-based planning
- Native Workday integration for workforce and financial data
- Intuitive dashboards and visualization
- Good collaboration tools for distributed teams
Cons
- Best value when paired with other Workday products
- Excel integration is functional but not Excel-native
- Reporting customization can be limited for complex requirements
4. Planful
Planful is a cloud financial analysis platform for structured planning, consolidation, and reporting. Features include pre-built planning templates, structured close management, automated financial reporting, multi-entity consolidation, and budgeting workflows with built-in approval chains. It also offers a financial close module for teams managing complex close cycles.
Best for: Mid-market companies ($100M–$1B) that need structured planning and consolidation. Pricing is custom, generally mid-five figures and up.
Pros
- Strong consolidation and close management
- Pre-built planning templates speed up implementation
- Good reporting automation
- Solid customer support
Cons
- Interface can feel dated compared to newer platforms
- Excel integration is add-on, not native
- Customization for complex models requires training
5. Vena Solutions
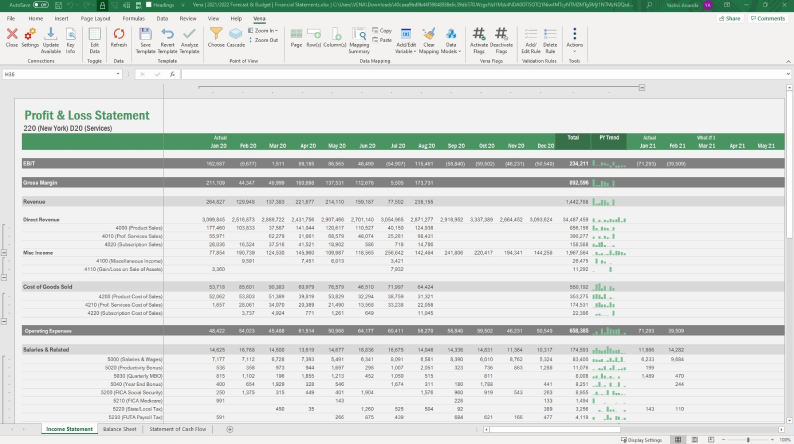
Vena Solutions is an Excel-based financial analysis tool that adds centralized data management, workflow automation, and audit trails on top of Excel. Features include version control, role-based permissions, pre-built FP&A templates, approval workflows, and automated data collection from source systems. Finance teams keep their models and templates while gaining governance.
Best for: Mid-market companies that rely heavily on Excel and need governance without changing workflows. Pricing is custom; third-party sources indicate starting around $5K/user/year.
Pros
- Deep Excel integration that preserves existing models
- Strong workflow automation and approval processes
- Role-based access and audit trails
- Pre-built templates for common FP&A tasks
Cons
- Consultant-led implementation can increase setup costs
- Limited Mac compatibility
- No Google Sheets support
6. Cube
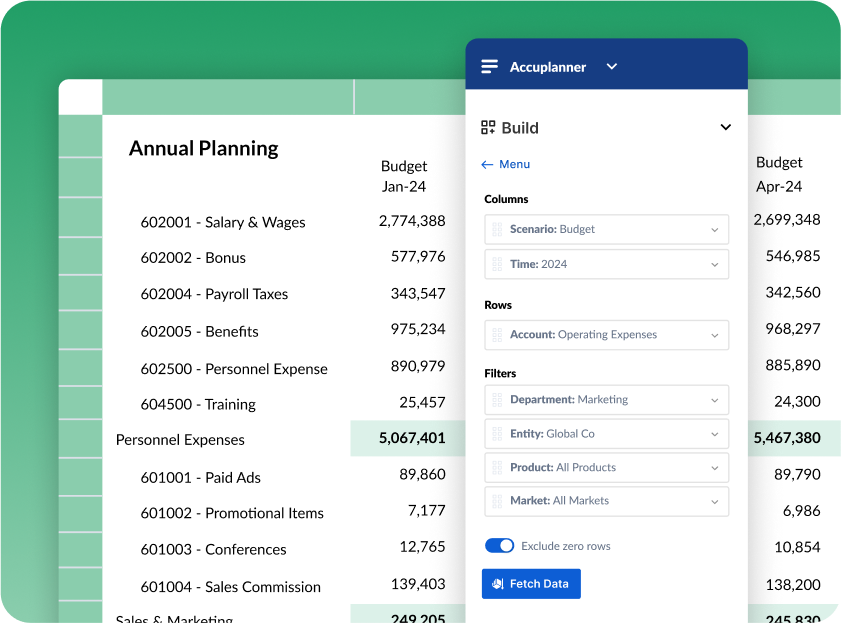
Cube is a spreadsheet-native FP&A software platform that works with both Excel and Google Sheets. Features include automated data consolidation, multi-scenario analysis, centralized reporting, approval workflows, and a shared data model that syncs across users. It is designed for teams that want speed and simplicity over heavy configuration.
Best for: SMB and mid-market teams that want fast implementation and spreadsheet flexibility, including Google Sheets support. Pricing is custom, positioned for mid-market budgets.
Pros
- Supports both Excel and Google Sheets
- Fast onboarding (claims up to 5x faster than competitors)
- Clean interface and intuitive user experience
- Good for teams with mixed spreadsheet environments
Cons
- Less depth for complex enterprise consolidation
- Smaller integration library than some competitors
- Newer platform with a smaller customer base
7. Oracle NetSuite
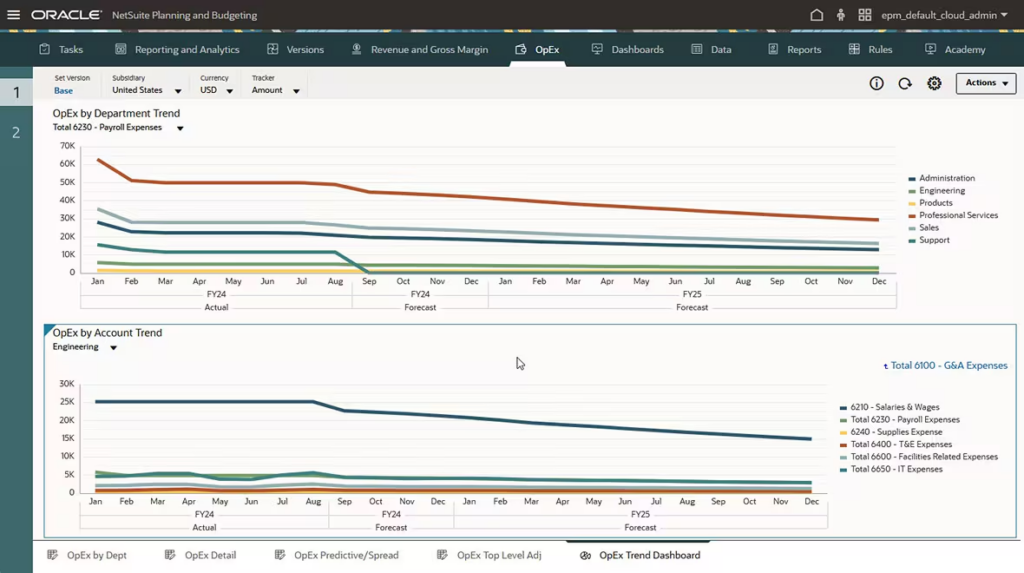
Oracle NetSuite is a cloud ERP with built-in financial data analysis tools. Popular features include real-time dashboards, customizable KPI reporting, multi-entity and multi-currency consolidation, role-based access, and a large library of pre-built reports. It handles accounting, consolidation, and basic FP&A within a single system.
Best for: Mid-market companies that want ERP and financial analysis in one system. Pricing is subscription-based and varies by configuration, typically starting in the low five figures annually.
Pros
- Unified ERP and financial reporting in one platform
- Real-time dashboards and customizable fields
- Strong multi-entity and multi-currency support
- Large ecosystem of integrations and add-ons
Cons
- Complexity can be overwhelming for smaller teams
- FP&A and planning capabilities are basic compared to dedicated tools
- Implementation and customization can be costly and time-consuming
8. Sage Intacct
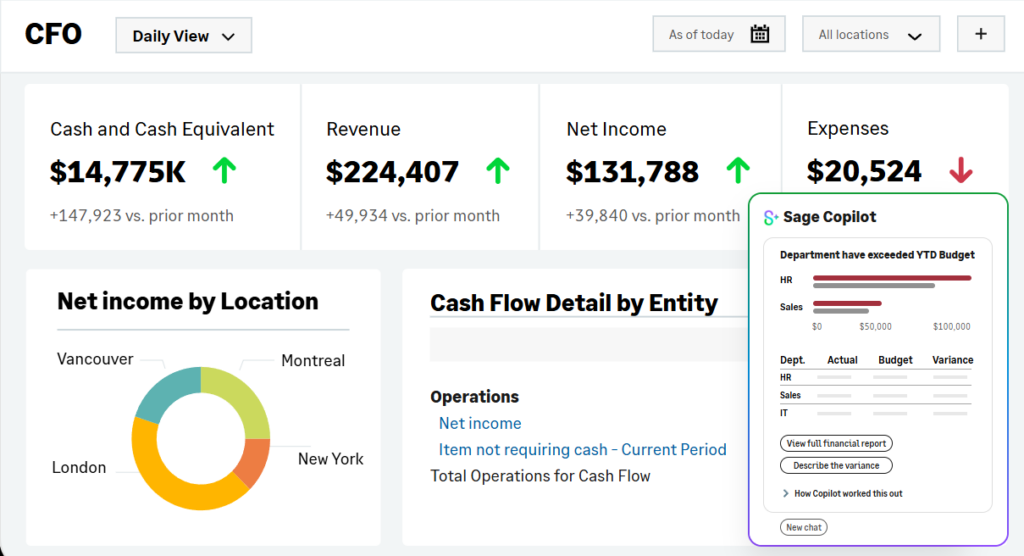
Sage Intacct is a cloud financial analysis software solution for small to mid-size businesses. Features include multi-entity consolidation, dimensional reporting across departments and locations, automated AP/AR workflows, real-time dashboards, and a structured close process. It is particularly strong in professional services and nonprofit accounting.
Best for: SMBs and mid-market companies that need strong accounting with good reporting capabilities. Pricing is subscription-based and custom, typically starting around $15K–$25K/year.
Pros
- Strong multi-entity consolidation
- Dimensional reporting for flexible analysis
- Good automation for AP/AR and close processes
- Well-suited for professional services and nonprofits
Cons
- FP&A capabilities are limited; often paired with a separate planning tool
- Customization of reports and dashboards can be restrictive
- Learning curve for users coming from simpler systems
9. SAP Analytics Cloud
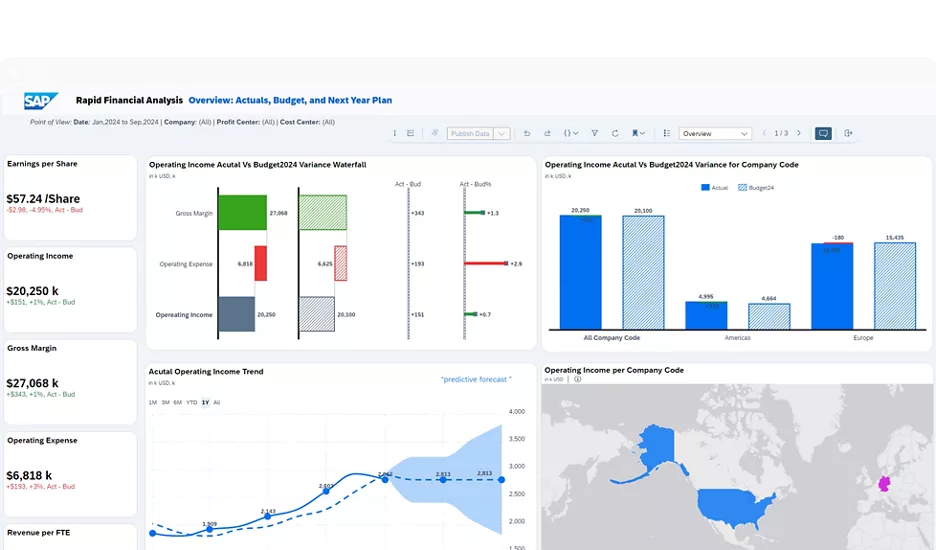
SAP Analytics Cloud is an enterprise financial analytics software platform that combines business intelligence, planning, and predictive analytics. Features include live data connections to SAP ERP, AI-powered forecasting, interactive data visualization, scenario modeling, and story-based reporting for boardroom presentations.
Best for: Large enterprises already running SAP ERP or S/4HANA. Pricing is per-user subscription; enterprise contracts are custom.
Pros
- Native SAP integration for real-time ERP data
- Combined BI, planning, and predictive capabilities in one tool
- Strong data visualization and storytelling features
- Enterprise-grade security and compliance
Cons
- Requires the SAP ecosystem to get full value
- Complex implementation
- Cost and complexity are prohibitive for smaller organizations
10. Jedox
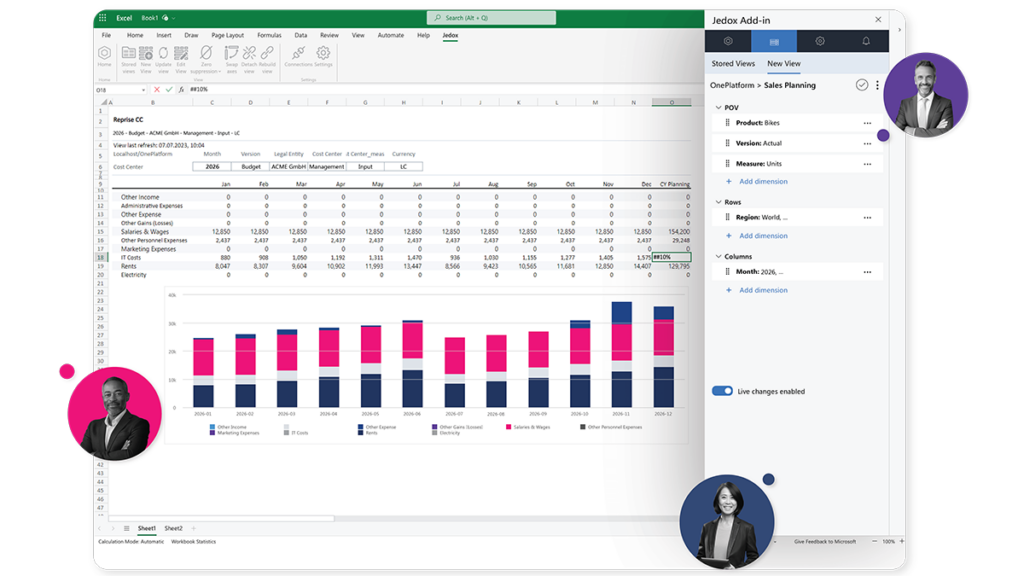
Jedox is a planning and analytics platform that combines Excel compatibility with centralized financial data analysis software capabilities. Features include an Excel add-in with a shared data backend, AI-assisted forecasting, multi-user collaboration with version control, and flexible modeling for both financial and operational planning.
Best for: Mid-market to enterprise companies that want Excel compatibility with centralized planning. Pricing is custom, positioned at the mid-to-high end.
Pros
- Excel add-in with a centralized data backend
- Flexible modeling for financial and operational planning
- AI-assisted forecasting
- Multi-user collaboration with version control
Cons
- Interface can feel complex for new users
- Implementation requires consultant involvement for advanced use cases
- Smaller presence in North America compared to Europe
11. Pigment
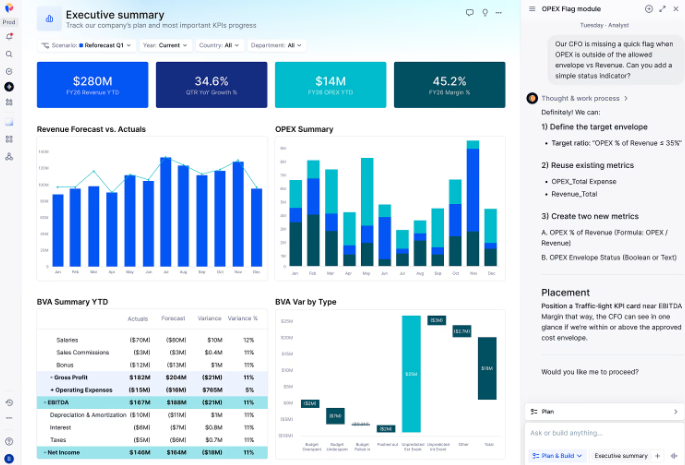
Pigment is a business planning platform designed for fast-growing companies. Features include real-time scenario modeling, headcount planning, revenue forecasting, collaborative workflows, and a flexible data model that doesn’t rely on rigid templates. It handles financial analysis, sales planning, and HR planning in one connected workspace.
Best for: High-growth mid-market and enterprise companies that need connected planning across finance, sales, and HR. Pricing is custom.
Pros
- Modern interface with strong collaboration features
- Flexible modeling without rigid templates
- Good for connecting financial and operational planning
- Fast-growing product with active development
Cons
- Relatively newer entrant with a smaller customer base
- Less Excel-native than some competitors
- Enterprise pricing may not suit smaller teams
12. Jirav
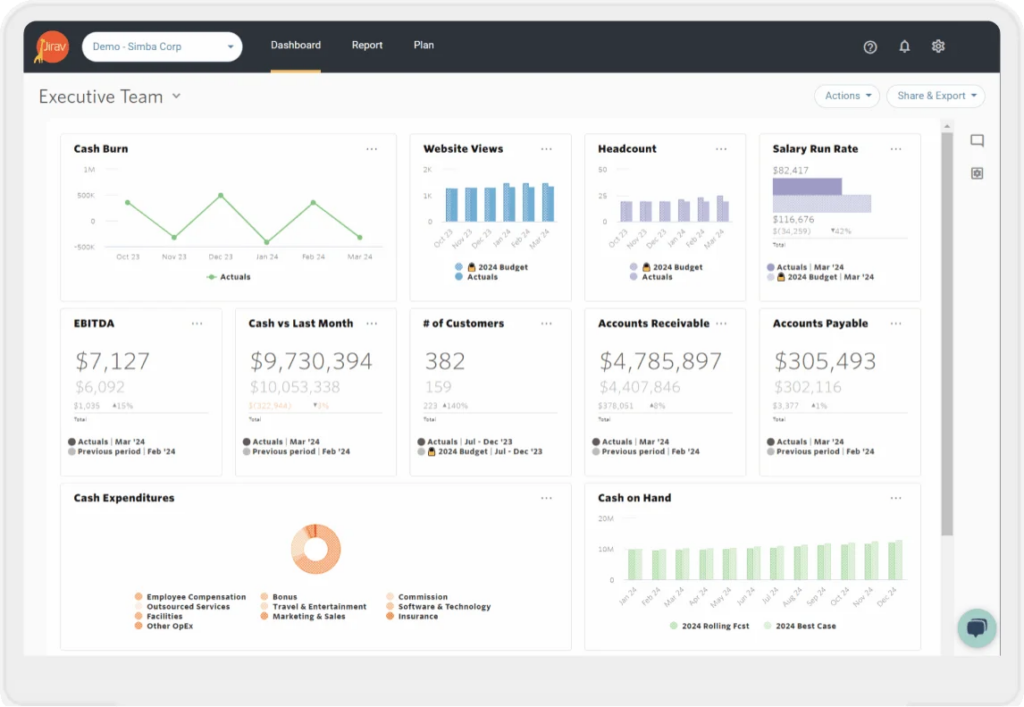
Jirav is a cloud-based financial analysis tool designed for small businesses and accounting firms. Features include industry-specific planning templates, budgeting and rolling forecasts, customizable dashboards, client management tools for accounting firms, and integrations with QuickBooks, Xero, NetSuite, and Sage Intacct.
Best for: Small businesses and outsourced finance/accounting firms. Pricing starts around $10K/year and scales with features and entity count.
Pros
- Industry-specific templates for fast setup
- Integrates with QuickBooks, Xero, NetSuite, and Sage Intacct
- Good for accounting firms managing multiple clients
- Affordable for smaller organizations
Cons
- Modeling flexibility is limited compared to mid-market tools
- Dashboard customization can feel basic
- Less suited for complex multi-entity enterprises
13. Abacum
Abacum is an FP&A software platform focused on collaborative planning, scenario analysis, and management reporting. Features include a flexible data model for granular driver-based planning, real-time variance analysis, board-ready management reports, and integrations with ERP, CRM, and HRIS systems for centralized financial data analysis.
Best for: Mid-market companies ($50M–$500M) that want deep scenario planning and modern reporting. Pricing is custom.
Pros
- Strong scenario planning and variance analysis
- Modern interface with good collaboration tools
- Flexible data model for granular driver-based planning
- Responsive customer support and onboarding
Cons
- Learning curve for building complex models
- Smaller integration library than larger competitors
- Newer platform still building out feature depth in some areas
14. Drivetrain
Drivetrain is an FP&A software platform that integrates planning, reporting, and analytics with ERP and BI tools. Features include flexible dimensions and table structures, automated data syncing across both accounting and BI platforms, custom metric builders, and support for both Excel and non-Excel workflows.
Best for: Mid-market SaaS and tech companies that want a connected planning tool with BI capabilities. Pricing is custom.
Pros
- Connects both ERP and BI tools in a single platform
- Flexible dimension and table structures
- Good for SaaS metrics and operational planning
- Clean user interface
Cons
- Some users report slower Google Sheets integration
- Forecasting features still maturing
- Smaller market presence compared to established players
How to Choose the Right Financial Analysis Software for Your Team
There’s no single best tool for every team. The right financial analysis software depends on how your finance function operates today and where it needs to go. Here’s what to evaluate:
- Company size and complexity: A 50-person company with one entity has different needs than a 2,000-person company with 15 subsidiaries across three currencies. Match the platform to the complexity of your financial structure, not just your headcount.
- ERP and systems integration: Check which systems the platform connects to out of the box. If your data lives in NetSuite, SAP, or Sage, make sure the tool has native integrations rather than requiring manual imports or middleware.
- Excel dependency: Some tools replace Excel entirely. Others work alongside it. If your team lives in Excel (and most do), look for platforms that preserve your existing models and workflows rather than forcing a migration.
- Use case depth: Are you solving for reporting first? Planning first? Full-cycle FP&A? A tool built for structured consolidation won’t necessarily excel at ad hoc scenario modeling, and vice versa. Be clear on the primary job before you evaluate features.
- Time to value and implementation: Some platforms take weeks. Others take months and require consultants. If your team needs results this quarter, implementation speed matters as much as feature depth.
- Team size and technical capability: A two-person finance team needs something different than a 20-person FP&A department. Consider who will own the tool day to day and how much training they’ll need.
- Pricing model and total cost of ownership: Sticker price is just the start. Factor in implementation fees, consultant costs, per-user charges, and what it takes to maintain the platform over time. AI budgeting tools can reduce long-term costs by automating work that previously required additional headcount.
Financial Analysis Software Is the Path Forward
The cost of staying on disconnected spreadsheets isn’t just inefficiency, it’s missed insight, delayed decisions, and a finance team stuck in data collection mode instead of driving strategy.
The tools in this guide represent a range of approaches to solving that problem. Some replace Excel, some build on top of it, some are built for enterprise scale, others for lean mid-market teams. The right choice depends on your data, your workflows, and how fast you need to move.
But the direction is clear. Finance teams that pair Excel with a modern financial analysis platform will close faster, forecast with more confidence, and give leadership the real-time visibility they’re asking for.
Get from Raw Data to Real Insight in Minutes
Datarails connects your ERP, CRM, and HRIS data into one platform, automates consolidation, and layers in AI-powered analysis. All without leaving Excel.
Financial Analysis Software FAQs
Financial analysis software is a category of tools that automates the collection, consolidation, and analysis of financial data. It replaces manual spreadsheet workflows with live dashboards, automated reporting, scenario modeling, and AI-powered forecasting so finance teams can spend less time on data wrangling and more time on strategic analysis.
It connects to your core systems (ERP, CRM, HRIS, billing) and pulls financial data into a centralized platform automatically. From there, teams can build reports, run variance analysis, create forecasts, and model scenarios without manually importing or reconciling data across spreadsheets.
It depends on your team size, systems, and workflows. For FP&A teams that want to stay in Excel while gaining automation and AI capabilities, Datarails is purpose-built for that use case. Enterprise teams with complex cross-functional planning needs may look at Anaplan or Workday Adaptive Planning.
By connecting forecasts to live data instead of static snapshots. When actuals flow in automatically, assumptions stay current, and models update in real time. AI-powered platforms also detect patterns and anomalies that manual analysis might miss.
The big ones: slow monthly closes, fragmented data across systems, manual reconciliation, stale forecasts, version control issues, and delayed reporting. It gives finance teams a single source of truth and automates the repetitive work that eats up most of their time.
At a minimum: automated data consolidation, real-time dashboards, variance analysis, scenario modeling, collaborative reporting with role-based access, and integrations with your ERP and accounting systems. AI-powered forecasting and anomaly detection are increasingly standard in the better platforms.
Traditional tools show you what happened. AI-powered financial analysis software shows you what’s likely to happen next. It uses pattern recognition, trend detection, and predictive modeling to surface insights that static reports can’t. It also automates routine analysis like variance explanations and anomaly flagging.