
There is a reason why FP&A and accounting professionals still rely on Excel after (almost) 40 years. It works.
What happens, though, when your organization grows and Excel can’t keep up with all of that data? Despite popular thinking that Excel can’t work for enterprises and beyond, you still don’t need to abandon the Excel ship.
You see, software, especially FP&A software, has continuously evolved since the inception of Excel. Yet, few (to none) have come close to Excel’s mathematical processing abilities and data storage capabilities. From financial forecasting and financial modeling to budgeting templates and month-end closing, reporting that would have taken hours can be presented in minutes via Excel spreadsheets — as long as you know what you are doing.
To get the most out of your spreadsheets, your accounting and FP&A teams should take a crash course in Excel for finance (the article you’re reading now is a great start) to ensure your team has all the Excel skills they need at their fingertips. Then, as your enterprise needs grow, you can integrate Excel with an automated solution.
The bottom line? You don’t need to scrap Excel for finance. You just need to discover how to enhance it.
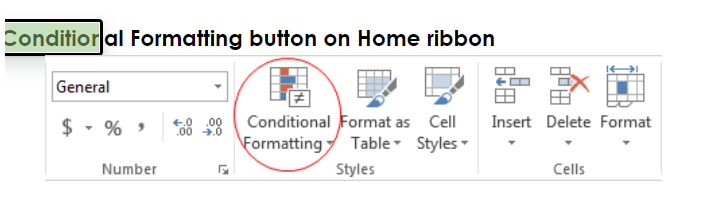
1. Conditional Formatting
Conditional formatting can be found on the home ribbon and is arguably the coolest of all the Excel tools because the possibilities presented are endless.
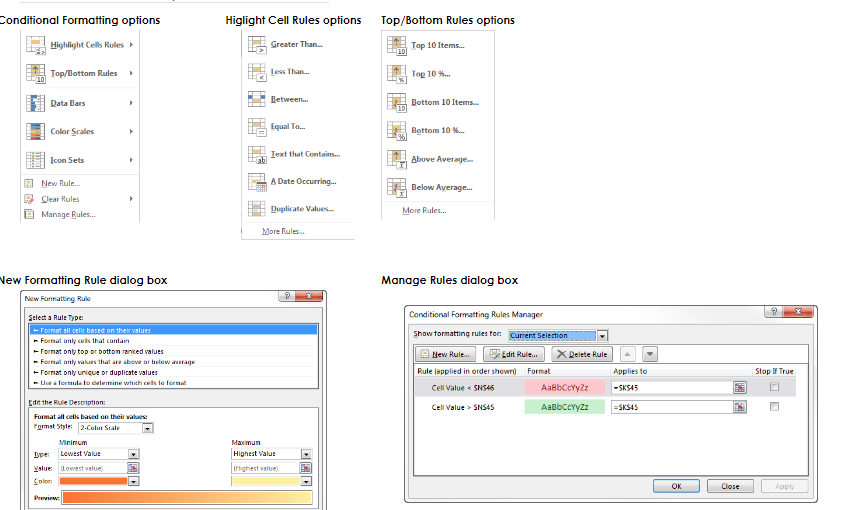
This function allows you to format cells based on the conditions you set.
For example, (on the most basic level) with a formula, you can set a condition that all cells within a specific range that result in a value greater than 45 should be the color red, and cells that result in a value less than 45 be green.
It’s as straightforward as:
- Choosing the New Rule option from the Conditional Formatting dropdown menu.
- Then selecting “Use a formula to determine which cells to format.”
- Then, in the “Format values where this formula is true:” box, enter the condition’s formula, and BAM!
And, here’s the beauty of conditional formatting — if you change the variables of any green cells to equal 46, the cell will automatically turn red.
How It Works for Finance
Conditional formatting helps accounting functionaries and finance professionals quickly spot any red flags. Think back to our basic example of red and green cells. Cells with a value > 45 might be overdue bills. So any cell that’s highlighted in red shows you at a glance which invoices are past due. You’ll also see that any cells in green are <45 days from the date of the invoice. When balancing your books and general ledger, conditional formatting can be a quick peek or a detailed deep dive.
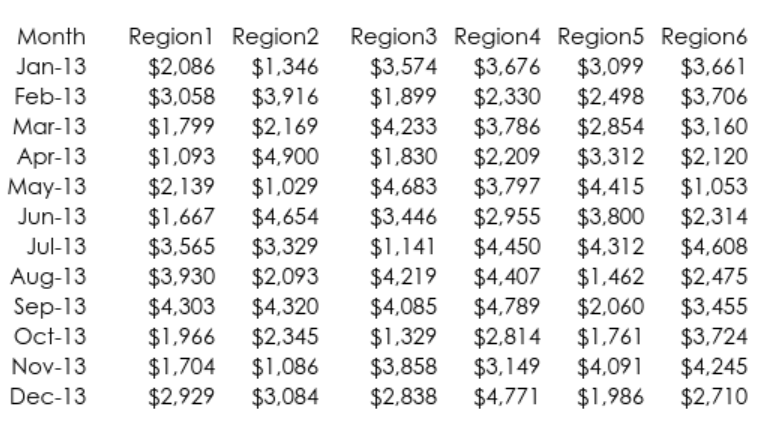
Conditional formatting allows for a lot of ingenuity on the part of the user and how they choose to implement formatting. So if you need to take a deep dive into your sales data, that’s easy, too!
If you are a regional sales manager and want to sort and highlight your sales by region while also highlighting the maximum sale in each region, just set the condition. Follow the same steps as above, and in the “Format values where this formula is true” box, enter the formula “=(Lcellnumber=MAX(L$107:L$118).”
You can also set the condition to the minimum sales amount following the same rules.
2. Automation and Macros
We met the coolest function in Microsoft Excel; now, let’s meet the most powerful function in Excel. With macros, you can automate almost anything in Excel with Visual Basic for Applications (VBA). VBA is a relatively easy programming language to learn, and you can get started with a quick course. In our opinion, VBA is a must-have for finance functionaries.
Don’t sweat it, though — even if you know nothing about programming, you can still record macros to perform some simple tasks, and you can even create buttons to run these macros and place them on your Quick Access Toolbar (QAT).
Macros are an easy way to automate steps you repeat frequently. You simply record the steps and save. With your preset macros, you can click a single button to execute those pesky repetitive tasks. Here’s how:

- Using the Developer Tab: Make the Developer tab and ribbon visible. If you do not see the Developer, right-click any ribbon, and then select Customize the Ribbon. Next, check the Developer item in the right pane of the dialog box. This ribbon has various buttons for working with macros. When you’re ready, click the Record Macro button on the Developer ribbon. This turns the recorder on. It will record everything you do until you turn the recorder off.
- When you click the Record Macro button, you will see the dialog box — fill it out and click OK. You can give the macro a meaningful name (no spaces), and you can specify where it should be stored. This will make the macro available at all times.

- Saving Your File: Starting in Excel 2007, macro files must have the .xlsm extension (“m” for macro). You aren’t allowed to save such a file as an .xlsx file.
- Storing Your Macros: There is a particular file, Personal.xlsb, that’s called your Personal Macro Workbook. This workbook is where you will keep your recorded macros. This file opens automatically as a hidden file whenever you open Excel. Therefore, all of its macros are always available in all your Excel files.
- Writing and Editing Macros: If you want to write your macros, or if you’re going to look at recorded macros, you need to go to the Visual Basic Editor. You can do this from the Visual Basic button on the Developer tab or, more efficiently, with the Alt+F11 keyboard shortcut.

How It Works for Finance
FP&A professionals use automated macros for financial modeling. To use VBA to build macros for your model, you first need to define your problem. Once you know the insight you need from the model — for example, if you want to forecast sales for Q4 — you can easily structure your logic, input your variables, define your output, and then run the macro. Model complete.
From mergers and acquisitions to corporate finance, modeling helps to identify the long-term financial health of a company. Additionally, it estimates and forecasts the capital outflow, which helps with project finance.
Bottom line: with macros, you have data visualization and the power to make the business decisions your enterprise needs.
3. Pivot Tables
We have met the coolest and the most powerful Microsoft Excel functions. Now, it’s time to meet every finance manager’s and CFO’s dream: the pivot table.
This function lets you slice and dice data in many ways. Pivot tables allow you to break down variables like sales and revenue by categories, such as region, month, and store.
Pivot tables only involve a few steps, but the results are still tremendous.
- Select a cell in the dataset and choose the Pivot Table button on the Insert ribbon.
- Excel guesses the data range (which you can override just like you can with the auto sum feature) and then asks where you want to place the pivot table.

How It Works for Finance
Pivot tables are a CFO’s dream because they take a dataset and present it as a table that can be modified or sorted based on different variables. Pivot tables give you multiple different views in a single table.
Once you are in the pivot table menu, you can drag categories like gender, region, paid with, and total costs to the rows and filter area. Each number in the pivot table is the sum of the total cost for its category values.


4. Charts and Visuals
While not the coolest, most powerful, or the apple of your CFO’s eye — charts are the storytellers of Excel. Nothing tells a story better than a well-designed chart, and Excel provides a considerable number of charting possibilities.
Creating charts that tell the story of your data to the decision-makers at your organization is just two simple steps:
- Use the Insert ribbon and find the Charts group with buttons for Column, Line, Pie, Bar, Area, Scatter, and Other Charts. Each choice has a dropdown menu for subtypes. Excel even has a Recommended Charts button for guessing the most appropriate type of chart for your specific data.
- Probably the most critical step is the Select Data button on the Design ribbon. Here you can edit the data range(s) the chart is based on. You can experiment with the other buttons, and you can also experiment by right-clicking various parts of a chart to see the many possibilities.

How It Works for Finance
Whether it’s for the purpose of financial reporting or financial forecasting, charts give you the visuals FP&A professionals need to tell their stories to the non-FP&A stakeholders and decision-makers in the organization.
What if you’re a global clothing retailer and you want to see how you did in the month of January? Easy. Make a bar graph, and you can easily see your revenue from each country.

5. Data and What-If Tables?
Data or what-if tables offer sensitivity analysis, a key part of most business models and the final skill you need to be a true Excel Ninja. You can find the Data Table option under the What-If Analysis dropdown on the Data ribbon.

How It Works for Finance
Because business modeling is all about what-ifs, that’s exactly what Excel is serving you. Now, you can ask questions about your data, like what would happen to profits if the unit cost increases by x%? Or what if our competitor’s price decreased by y%?
Data tables answer these questions in a systematic way. There are two types of what-if tables: one-way and two-way. A one-way data table has one input and any number of outputs, and a two-way data table has two inputs but only one output.
Let’s say you are a car salesman and need to calculate the interest rates for your client — a one-way data table is perfect for this. The single input is the interest rate, but there are two outputs: the monthly payment and the total interest to be paid.

The 5 skills were compiled by Annette DeYoung FP&A Solutions Consultant at Datarails, who led Financial Planning at J.L Clark, an industry-leading supplier of high quality custom metal and plastic packaging. She previously held senior finance and planning positions at Berner Food and Beverage, Rockford Products and Fairbanks Morse Engine.
Now, we have even more as a bonus for you. Christian Wattig Customer Service Team Leader at Datarails also advises bonus tips built up over his decades of experience in FP&A.as former FP&A Lead at Squarespace, Procter & Gamble, Unilever, and Avon. Christian who runs a leading FP&A Course recommends these further 7 Excel tips everyone in FP&A needs to know.
Bonus Tips for FP&A Leaders in Excel
1. Use Check-sums
Your reputation is built over years and ruined in seconds, says Christian. For example, a presentation to the board of directors with wrong numbers can be a big hit to your career. So, you need to have a way to check your work in Excel before you press SEND.
Check-sums are formulas that calculate results differently and compare that to what’s shown in the table. If it doesn’t match, there is likely a mistake somewhere.
2. Separate inputs from outputs
If you mix cells that contain data copied from somewhere else with cells that have formulas, mistakes are bound to happen. Say you are approaching an important deadline, and – unexpectedly – your business partners gave you a new assumption. To avoid issues, we would recommend having all your input cells in a separate tab. That way you minimize the risk of accidentally breaking a formula.
3. Use Index/Match or XLOOKUP instead of V-lookup
V-lookup has some big disadvantages. For example, if a column gets added to your source table, your formula may show the wrong result. And it won’t even give you an error message! That’s because V-lookup is a static cell reference. Index/match and X-lookup are dynamic, so they adjust automatically if there is a change in the source.
4. Avoid complicated formulas
Your Excel models need to accomplish two things:
You need to be able to make changes as quickly as possible so that you can answer questions on the spot.Someone else needs to be able to take it over when you are sick or otherwise unable to respond.
If you have nested IF() statements all over the place, achieving both objectives gets more difficult. Always think about the easiest way to get to the desired results. For example, multiple helper columns may be easier to navigate than a single long formula.
5. Rely on macros only when necessary
Automation and Macros are useful (as set out earlier) and are a big time-saver, for example, when you have to consolidate multiple reports, and you don’t have a sound FP&A system to rely on. But they also break easily because they aren’t dynamic. And they are difficult to understand for anyone who wasn’t involved in creating them. Few people know how to read VBA code. So try to use them only when there is no other way.
6. Frequently save under a new name
There is nothing worse than finally finishing a big Excel model just to realize that you must have made a mistake a few days ago. It’s best practice to save the model under a new name, whenever you make a big update. That way it’s easy to “roll back” the last version that was error-free and take it from there.
7. Document assumptions
Even the best Excel model fails the test of time if no one understands where the assumptions came from after a few weeks. Always add a tab that lists the most important inputs (you can link to them) and states:
a) Who provided the assumption
b) When was it last updated
c) Which facts or data points is it based on
Automate and Leverage Excel to Do Even More with Datarails
Whether you learned something new about Excel or refreshed your skills; if this felt like a lot of information to take in, here are the highlights:
- For FP&A professionals, Excel is a must-have skill.
- Financial analysis, financial modeling, and financial reporting are easily done in Excel because of its unmatched capabilities in mathematical calculations, consolidation formatting, and VBA/macro tools.
- While some organizations have tried to move away from Excel, they almost always come back. Why force your finance folks to learn and adapt to new applications?
And you don’t have to force your accounting and FP&A departments to adapt to new applications or software. You can complement Excel with an integrated solution like Datarails.
Datarails transforms Excel into a lean, mean FP&A machine. Here’s the best part: you get to keep using your Excel financial models and spreadsheets while automating repetitive processes. Datarails is the financial planning and analysis platform that empowers finance teams. And when you use Datarails, you overcome Excel’s limitations by adding data integrity, up-to-the-minute and real-time updates, and version controls. So even if your data is becoming unmanageable, Datarails has the solution to automate and leverage Excel.
To learn more about Datarails and Excel, check out the Excel category on our blog. To find more information about maximizing your Excel skills, check out these 7 courses that will supercharge your finance.
Want to play around more with Excel and Datarails templates? Try these 10 Excel Budget Templates.