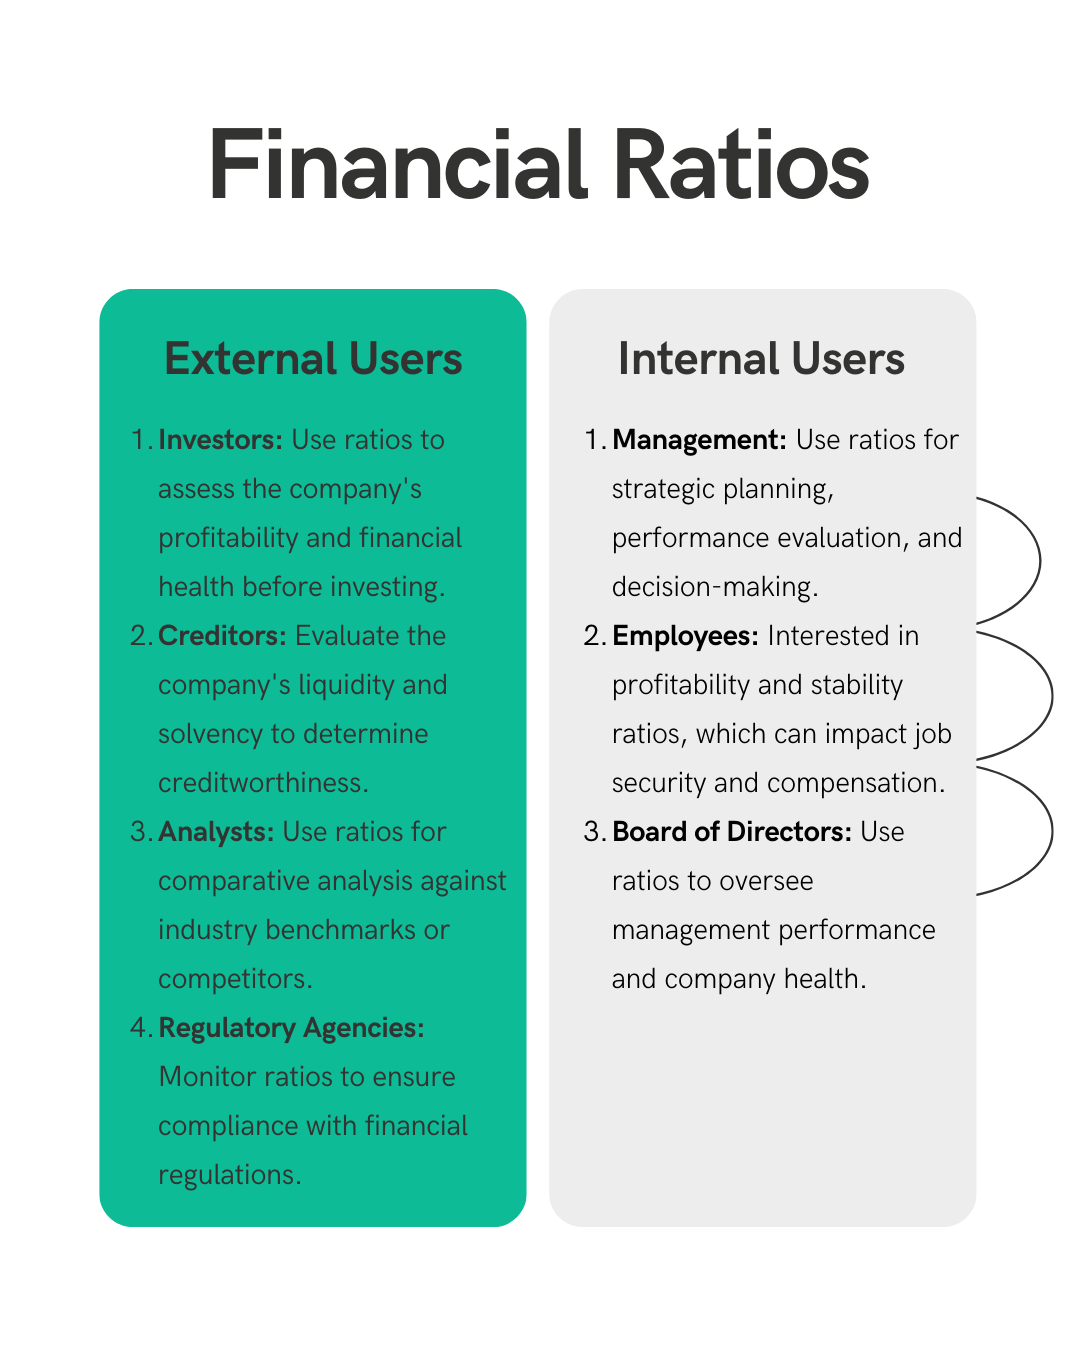
Navigating the world of business evaluation can be difficult, especially for founders eager to measure their venture’s success. The maze of numbers and calculations might seem overwhelming. But what if there was a straightforward way to decode these figures?
Dive into this guide and uncover the power of financial ratios. They’re simpler than you think, and they could be the key to unlocking your business’s true potential.
What Are Financial Ratios?
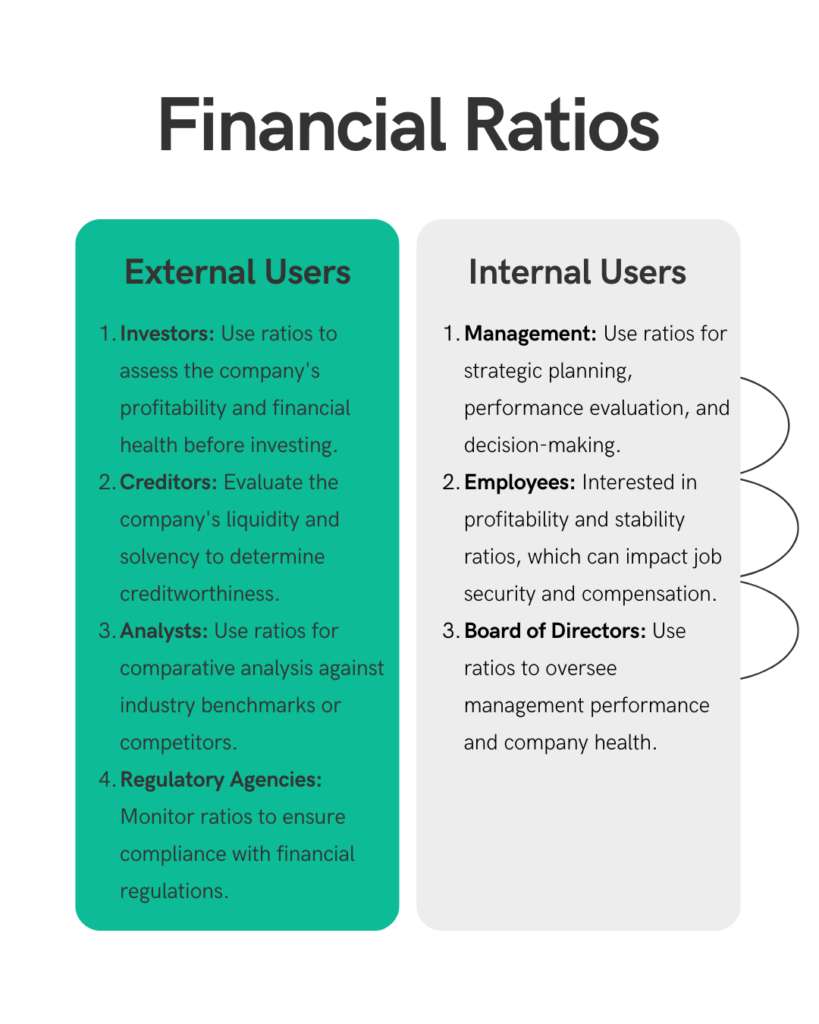
Financial ratios are numerical values calculated from a company’s financial statements to assess its operational efficiency, profitability, liquidity, and overall financial health.

Source: Google
For example, one ratio (Profit Margin Ratio) might tell us how much profit a company is making compared to its expenses.
Another ratio (Current Ratio) could show us if a company has enough money to pay its bills. These ratios give us a standard way to look at a company’s finances and see if it’s doing well or if there might be some problems.
Various Types of Ratio Analysis
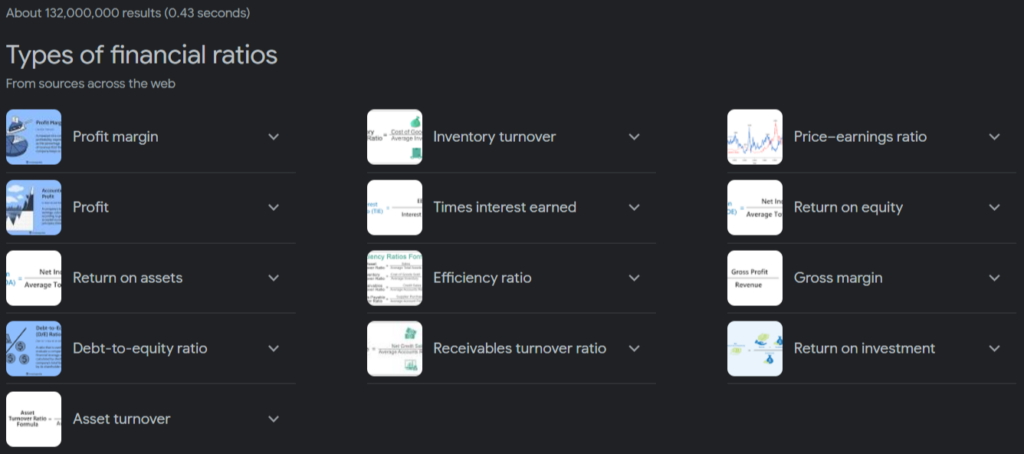
Financial ratios can be categorized into distinct groups, each offering valuable insights based on the data they provide.
Source: Google
The main types of ratio analysis include the following:
1) Liquidity Ratios
These ratios measure a company’s ability to pay off its short-term debts using its short-term assets.
- Current Ratio: It indicates whether a company has enough assets to cover its short-term liabilities.
- Quick Ratio (Acid-Test Ratio): It is similar to the current ratio but excludes inventory from current assets before dividing by current liabilities. It is a more stringent measure of a company’s short-term liquidity.
- Cash Ratio: It indicates a company’s ability to pay off its current liabilities using only cash and cash equivalents.
- Operating Cash Flow Ratio: This ratio measures a company’s ability to pay off its current liabilities using the cash generated from its core business operations.
Formulas:
- Current Ratio = Current Assets / Current Liabilities
- Quick Ratio = (Current Assets – Inventory) / Current Liabilities
- Cash Ratio = Cash and Cash Equivalents / Current Liabilities
- Operating Cash Flow Ratio = Operating Cash Flow / Current Liabilities
2) Profitability Ratios
These ratios measure a company’s ability to generate profits relative to its revenue, operating costs, balance sheet assets, or shareholders’ equity.
- Net Profit Margin: It indicates the percentage of revenue that remains as profit after all expenses have been deducted.
- Gross Profit Margin: It indicates the percentage of revenue that remains after deducting the cost of goods sold.
- Return on Assets (ROA): It indicates how efficiently a company is using its assets to generate profits.
- Return on Equity (ROE): It indicates how efficiently a company is using its equity to generate profits.
Formulas:
- Net Profit Margin = Net Profit / Total Revenue
- Gross Profit Margin = Gross Profit / Total Revenue
- Return on Assets (ROA) = Net Income / Total Assets
- Return on Equity (ROE) = Net Income / Shareholders’ Equity
3) Solvency Ratios
These ratios measure a company’s ability to meet its long-term debts and financial obligations.
- Debt to Equity Ratio: It indicates the relative proportion of debt and equity used to finance a company’s assets.
- Interest Coverage Ratio: It indicates a company’s ability to cover its interest payments with its operating income.
- Equity Ratio: It indicates the proportion of a company’s assets that are financed by equity.
Formulas:
- Debt to Equity Ratio = Total Debt / Shareholders’ Equity
- Interest Coverage Ratio = Earnings Before Interest and Taxes (EBIT) / Interest Expenses
- Equity Ratio = Equity / Total Assets
4) Efficiency Ratios
Efficiency ratios measure how efficiently a company is using its assets and liabilities to generate sales and profits.
- Asset Turnover Ratio: It indicates how efficiently a company is using its assets to generate sales.
- Inventory Turnover Ratio: It indicates how efficiently a company is managing its inventory.
- Receivables Turnover Ratio: It indicates how efficiently a company is collecting its receivables.
Formulas:
- Asset Turnover Ratio = Net Sales / Average Total Assets
- Inventory Turnover Ratio = Cost of Goods Sold / Average Inventory
- Receivables Turnover Ratio = Total Sales / Average Accounts Receivable
5) Market Ratios
These ratios are used by investors to determine the relative value of a company’s shares and its financial performance.
- Earnings Per Share (EPS): It indicates the portion of a company’s profit allocated to each outstanding share of common stock.
- Price to Earnings Ratio (P/E): It indicates the relative value of a company’s shares.
- Dividend Yield: It indicates the return on investment for a company’s shares.
- Book Value Per Share: It indicates the book value of a company’s shares.
Formulas:
- Earnings Per Share (EPS) = Net Income / Number of Outstanding Shares
- Price to Earnings Ratio (P/E) = Market Price Per Share / Earnings Per Share
- Dividend Yield = Annual Dividend Per Share / Market Price Per Share
- Book Value Per Share = Total Equity / Number of Outstanding Shares
6) Leverage Ratios
Leverage ratios assess a company’s ability to meet its financial obligations using debt.
- Debt Ratio: It indicates the proportion of a company’s assets that are financed by debt.
- Debt to Equity Ratio: It indicates the relative proportion of debt and equity used to finance a company’s assets.
- Equity Ratio: It indicates the proportion of a company’s assets that are financed by equity.
- Interest Coverage Ratio: It is calculated by dividing a company’s earnings before interest and taxes (EBIT) by its interest expenses. It indicates a company’s ability to cover its interest payments with its operating income.
- Financial Leverage Ratio: It indicates the degree to which a company is using debt to finance its assets.
Formulas:
- Debt Ratio = Total Debt / Total Assets
- Debt to Equity Ratio = Total Debt / Shareholders’ Equity
- Equity Ratio = Equity / Total Assets
- Interest Coverage Ratio = Earnings Before Interest and Taxes (EBIT) / Interest Expenses
- Financial Leverage Ratio = Average Total Assets / Average Total Equity
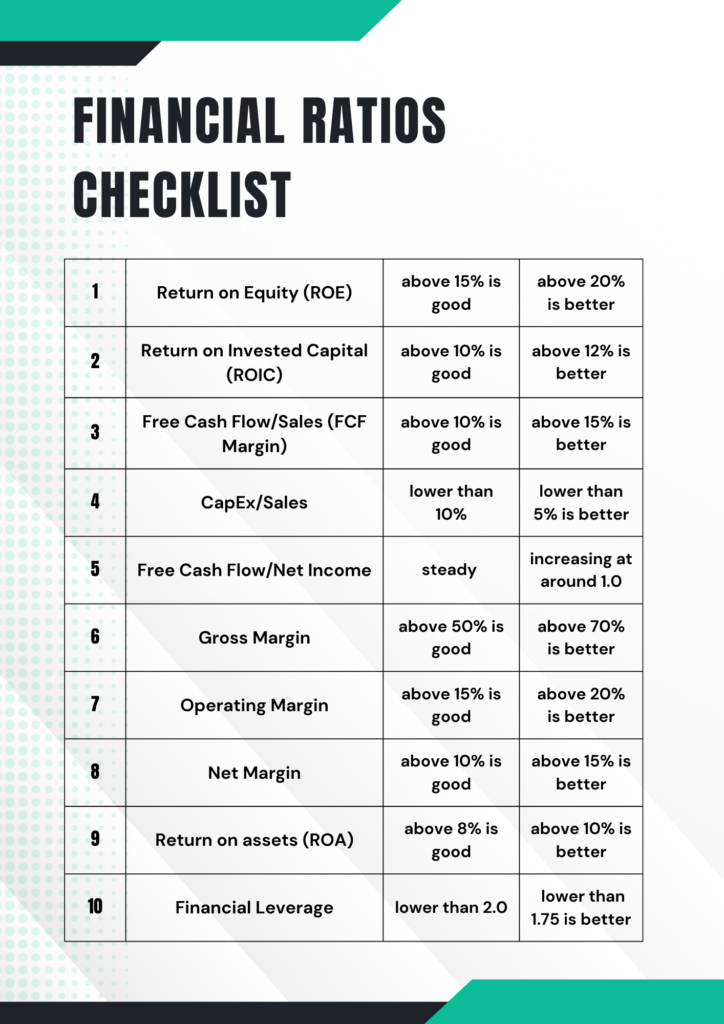
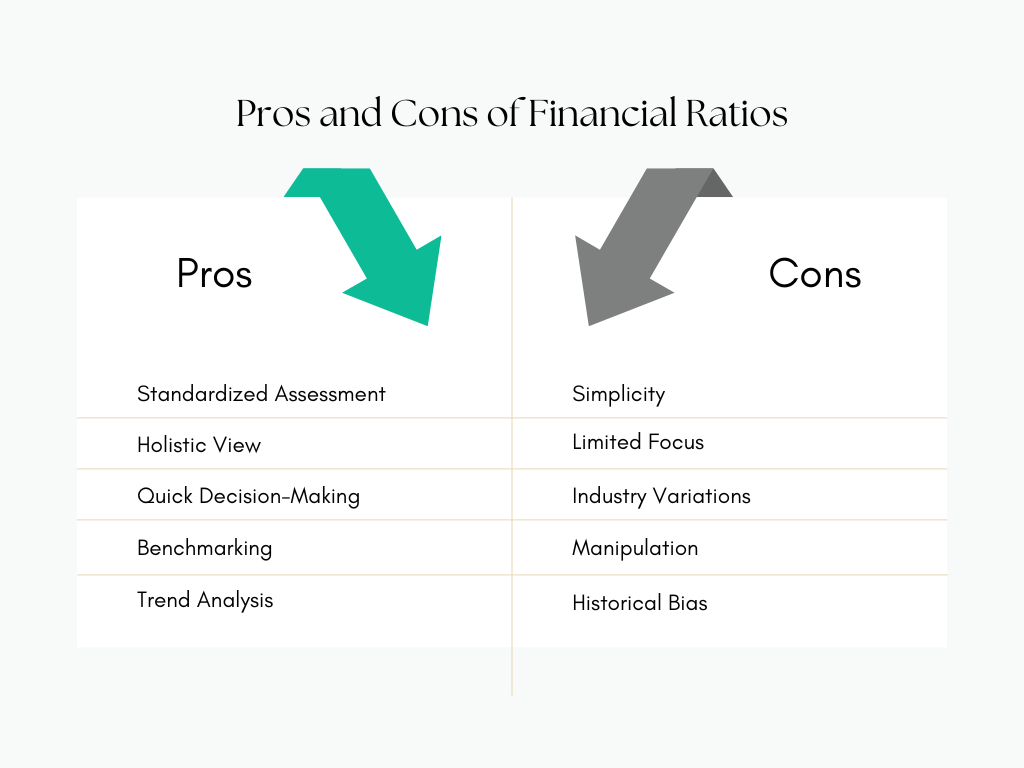
Pros and Cons of Financial Ratios:
Like everything else, Financial ratios come with both advantages and limitations.
Pros of Financial Ratios:
- Standardized Assessment: Ratios provide a standardized way to compare companies across industries and sizes, enabling fair evaluations.
- Holistic View: They offer a comprehensive picture of financial performance, encompassing liquidity, solvency, profitability, and efficiency.
- Quick Decision-Making: Ratios provide quick snapshots, aiding timely decisions without delving into complex financial statements.
- Benchmarking: They allow comparison with industry standards, helping identify if a company outperforms or lags behind its peers.
- Trend Analysis: Over time, ratios highlight a company’s performance trends, aiding in understanding its trajectory.
Cons of Financial Ratios:
- Simplicity: Ratios oversimplify complex financial situations and may not capture the full context.
- Limited Focus: They focus solely on quantitative aspects, neglecting qualitative factors like management competence.
- Industry Variations: Ratios’ interpretation varies across industries due to diverse operational and financial dynamics.
- Manipulation: Companies can manipulate financial data to present better ratios, undermining their accuracy.
- Historical Bias: Ratios rely on historical data, which may not predict future performance accurately.
Determining Appropriate Use
While financial ratios offer valuable insights into a company’s financial health, it’s essential to understand when and how to use them effectively. Different scenarios call for the application of financial ratios to ensure accurate assessments and informed decision-making.
1) Comparing Companies on an Equal Footing:
Financial ratios are particularly useful when comparing companies of varying sizes or in different industries. They provide a standardized framework that enables fair comparisons. For instance, when evaluating the liquidity of two companies—one in the manufacturing sector and another in the service industry—ratios like the current ratio help level the playing field by considering their unique operational characteristics.
2) Assessing Historical Performance and Predicting Trends:
Financial ratios are valuable for analyzing a company’s historical performance and identifying trends. By comparing ratios over several years, investors and stakeholders can gauge the company’s consistency and trajectory. A declining liquidity ratio, for example, could indicate worsening short-term solvency and prompt a closer examination of the company’s financial management.
3) Gaining Insights into Industry-Specific Dynamics:
Ratios allow for meaningful benchmarking against industry norms. They help stakeholders understand whether a company is performing in line with its peers or if it’s lagging behind. A tech startup’s profitability ratios, for instance, might differ significantly from those of a pharmaceutical company due to the distinct characteristics of their industries. Analyzing ratios in an industry context helps identify outliers and potential areas for improvement.
4) Making Informed Investment Decisions:
Investors use financial ratios to assess the potential of their investment. Ratios like return on equity (ROE) and return on assets (ROA) offer insights into how efficiently a company is using its resources to generate profits. These ratios help investors determine if a company’s business model aligns with their investment goals and risk tolerance.
A Word of Caution:
While financial ratios offer valuable insights, they shouldn’t be the sole basis for decision-making. It’s important to consider qualitative factors that ratios may not capture, such as changes in management, competitive landscape, or industry disruptions. A thorough analysis involves a combination of quantitative and qualitative assessments to make well-informed decisions.
Ratio Analysis Over Time for Strategic Insights
Ratio analysis over time is a critical financial aspect that companies use to assess their performance, identify trends, and make strategic decisions. It involves calculating specific financial ratios at regular intervals and analyzing how these ratios change over time.
Here are the key points of this process:
- Long-term Planning: Companies use ratio analysis over time for strategic planning and long-term success.
- Performance Evaluation: Businesses track their trajectory, evaluate past performance, and identify effective changes.
- Risk Identification: Ratio analysis helps in pinpointing potential future risks.
- Seasonal Fluctuations: Companies remain mindful of seasonal fluctuations and temporary changes in account balances.
- Evolution Analysis: The power of this approach lies in analyzing how ratios have evolved over time.
- Performance Insights: Businesses gain insights into their financial performance and can make well-informed strategic decisions.
How Ratio Analysis Meets Benchmarks
Companies often set internal targets for their financial ratios to maintain or improve their performance. External parties, like lenders, also set benchmarks that companies must meet. Here are the key points:
- Internal Targets: Companies set internal targets for their financial ratios to drive operational growth or maintain current levels. For example, a company might aim to improve its current ratio to enhance liquidity.
- External Benchmarks: Lenders often impose benchmarks as part of loan agreements. Companies must adhere to these metrics, or they could face consequences like loan recall or higher interest rates.
- Consequences of Not Meeting Benchmarks: If a company fails to meet these benchmarks, it may face higher interest rates or callable loans to compensate for the perceived risk.
- Debt Service Coverage Ratio: This is an example of a lender-imposed benchmark that evaluates a company’s cash flow in relation to its debt balances.
Case Study: Analyzing Apple Inc.’s Financial Ratios
Let’s delve into a case study involving Apple Inc., a technology giant known for its innovative products and global presence.

Source: Apple
By examining its financial ratios, we can gain insights into how ratios can provide a comprehensive view of a company’s financial performance.
Liquidity Ratios:
Apple’s current ratio (current assets divided by current liabilities) reflects its short-term liquidity. In 2021, Apple’s current ratio was 1.06. This suggests that Apple had $1.06 in current assets to cover each dollar of current liabilities. A ratio above 1 indicates that the company can meet its short-term obligations, while a lower ratio could indicate potential liquidity challenges.
Profitability Ratios:
Examining Apple’s profitability ratios can shed light on its ability to generate earnings. In 2021, Apple’s net profit margin, calculated as net income divided by total revenue, was approximately 21.9%. This signifies that Apple retained 21.9% of its revenue as profit. A strong net profit margin indicates effective cost management and pricing strategies.
Efficiency Ratios:
Apple’s efficiency can be assessed using inventory turnover ratio, which measures how effectively the company manages its inventory. In 2021, Apple’s inventory turnover was around 83.7, indicating that the company sold its inventory approximately 83.7 times during the year. A high inventory turnover implies efficient inventory management and faster sales cycles.
Solvency Ratios:
Solvency ratios gauge a company’s ability to meet its long-term obligations. Apple’s debt-to-equity ratio in 2021 was 1.57. This suggests that for every dollar of equity, Apple had $1.57 of debt. While a higher ratio could indicate higher financial risk, it’s important to consider that Apple’s robust profitability helps mitigate this risk.
Market Ratios:
Market ratios reflect investor sentiment and valuation. Apple’s price-to-earnings (P/E) ratio in 2021 was approximately 29.1. This suggests that investors were willing to pay $29.1 for every dollar of Apple’s earnings. A higher P/E ratio can indicate high growth expectations or investor confidence.
Source: Financial data and ratios for Apple Inc. were obtained from its annual report for the fiscal year 2021, available at Apple Investor Relations.
Examples of Ratio Analysis in Action
Ratio analysis is a critical tool in financial management, providing insights into a company’s operational efficiency, liquidity, profitability, and solvency. Two key ratios often analyzed are inventory turnover and debt-to-equity.
- Inventory Turnover: This ratio measures how quickly a company sells and replenishes its inventory within a specific period. A higher inventory turnover ratio indicates efficient sales and inventory management, which can lead to improved cash flow and reduced carrying costs.
- For example, in the retail sector, if Company XYZ has an inventory turnover ratio of 8 and Company LMN has a ratio of 4, it suggests that XYZ is more efficient in managing its inventory, leading to better cash flow and cost management.
- Debt-to-Equity Ratio: This is a significant leverage ratio that assesses a company’s financial risk and capital structure. It indicates the proportion of funding that comes from debt versus equity. A lower ratio suggests a more conservative financial approach with less reliance on debt financing.
- For instance, in the manufacturing industry, if Company PQR has a debt-to-equity ratio of 0.5 and Company STU has a ratio of 1.5, it indicates that PQR relies more on equity for its financing, which could make it more resilient during economic downturns.
The Bottom Line
In conclusion, financial ratios are vital for gauging a company’s financial health and potential. From liquidity to profitability ratios, these metrics offer insights into various business performance aspects.
These numerical metrics provide a standardized and objective way to compare companies across industries and sizes, enabling investors and analysts to make well-informed decisions. They offer a comprehensive view of a company’s strengths and weaknesses, acting as valuable benchmarks for performance evaluation.
However, it is essential to remember that financial ratios are not standalone measures. For a more accurate understanding of a company’s overall performance, they must be analyzed in conjunction with other qualitative and quantitative factors.
***************
The article was written by Oran Yehiel, founder at Startup Geek.