The financial world is filled with terms that can seem intimidating to someone without a strong finance background. One such finance term is Chart of Accounts.
The chart of accounts is full of details and can contain a considerable amount of data entries and rows in Excel.
We promise it’s not as confusing as it might seem at first!
Here, we’ll break down what it is and how it works to offer the clarity you’re looking for.
Defining Chart of Accounts (COA)
A Chart of Accounts (COA) is an index of all the financial accounts in a company’s general ledger and is the foundation of the company’s financial system.
The chart of accounts is categorized and itemized, making it one of the most fundamental and detailed tools for registering financial activities and for financial reporting.
Chart of Accounts: Function and Purpose
A chart of accounts is a vital financial tool that organizes numerous financial transactions in a manner that is easy to access.
Because transactions are displayed as line items, they can be quickly found and assessed.
Furthermore, big companies can have thousands of line items, so a chart of accounts allows them to be easily divided into different hierarchies and categories.
This is crucial for categorizing, sorting, and reporting data.
Why the Chart of Accounts Matters
The chart of accounts is vital in offering interested parties, such as investors and shareholders, a clear and transparent view of a company’s financial health.
This comprehensive listing of accounts in the general ledger allows for easy organization of finances.
Each COA typically features an identification code, name, and brief description to facilitate the quick location of specific accounts. Businesses can adjust their COAs to reflect their size and nature so the tool remains relevant and useful.
For accuracy in period-to-period comparisons, maintain the same chart of account format over time.
Anatomy of a COA
A chart of accounts operates like a personal finance tool.
For instance, if you have different types of bank accounts, such as checking, savings, and a certificate of deposit, you would typically see an overview of your balances when you log into your online account.
Similarly, using a personal finance app that aggregates all your financial accounts, like Mint or Personal Capital, provides a view similar to that a COA offers a business—a complete overview of assets and liabilities.
The structure of a COA can vary depending on the company’s size and the nature of its business. However, most COAs follow a specific structure designed to mirror the order of information as it appears in financial statements.
Structure of Chart of Accounts
The COA is generally structured to display information in the same sequence as consolidated financial statements. This means balance sheet accounts are listed first, followed by income statement accounts.
Primary accounts such as assets, liabilities, shareholders’ equity, revenue, and expenses can be further divided into sub-accounts.
These sub-accounts include operating revenues, operating expenses, non-operating revenues, and non-operating losses. Business functions or company divisions may also organize the sub-accounts.
COA Categories
Below is a breakdown of primary categories and their respective subcategories and examples.
Assets
Assets are economic resources, whether tangible or intangible, that the company owns or controls and that are expected to provide future economic benefits.
They are generally subdivided into two major subcategories: current assets and noncurrent (or fixed) assets.
Current Assets:
- Cash: Physical cashflow on hand, checking accounts, and savings accounts.
- Accounts receivable: The amount owed to the company by customers for goods or services delivered but not yet paid for.
- Inventory: Goods available for sale or materials used in production.
- Prepaid expenses: Money paid in advance for a service or good that will be received later. For example, insurance premiums.
Non-Current (Fixed) Assets:
- Property, Plant, and Equipment (PP&E): Fixed assets used in business operations, including buildings, machinery, and vehicles.
- Intangible assets: Non-physical assets such as patents, trademarks, and goodwill.
- Long-term investments: Securities the company will hold for over a year, such as bonds or stocks.
Liabilities
Liabilities are the claims others have against the company, representing the company’s obligations to others. Like assets, liabilities are split into current and non-current liabilities.
Current Liabilities:
- Accounts payable: Money due to be paid to suppliers for goods or services that have been delivered and received but not yet paid.
- Accrued liabilities: Liabilities incurred (obligations to pay) but not yet fallen due (not yet payable), such as salaries or taxes payable.
- Short-term loans: Loans or borrowings that are due within one year.
- Unearned revenue: Payments received before services have been rendered or goods delivered.
Non-Current Liabilities:
- Long-term debt: Any loans or borrowings due more than one year from the date. (For example, a mortgage or bonds payable.)
- Deferred tax liabilities: Taxes accrued but not payable until a future date.
- Pension liabilities: Obligations to pay future retirement benefits to employees.
Equity
Equity represents the owners’ claims to the company’s assets after all liabilities have been paid off. It reflects the residual interest in the company.
- Common stock: Represents the ownership shares issued to shareholders.
- Retained earnings: Cumulative net income retained in the company after paying dividends.
- Additional paid-in capital: Extra amounts received from shareholders over the stock’s par value.
- Treasury stock: Shares that were issued and later reacquired by the company.
Revenue
Revenue accounts record the revenue generated by the entity from revenue-generating operations. These are typically broken down into operating and non-operating revenue.
Operating Revenue:
- Sales Revenue: Income from the sale of goods or services.
- Service Revenue: Fees earned from providing services.
Non-Operating Revenue:
- Interest income: Earnings from interest on investments.
- Rental income: Income earned from renting out property or equipment.
Profits are generated from the sale of assets outside the company’s regular business operations.
Expenses
Expenses are the funds a company must spend to generate revenue.
There are two categories of expenses: direct and indirect.
Direct Expenses:
- Cost of Goods Sold (COGS): The direct cost of producing goods (or services), such as the raw materials and labor used in the production process itself.
- Direct labor: Wages paid to workers directly involved in the production process.
- Manufacturing supplies: Materials and supplies consumed in the manufacturing process.
Indirect Expenses:
- Administrative expenses: These include the cost of maintaining general operations, such as office staff salaries, office supplies, and utilities.
- Marketing and advertising expenses: Costs associated with promoting products or services.
- Depreciation expense: Allocating the cost of tangible fixed assets over their useful lives. Premiums paid for this business insurance include liability, property, etc.
Utilities: Costs of electricity, water, gas, and other utilities.
Account Identifiers in Chart of Accounts
A chart of accounts usually contains identification codes, names, and brief descriptions for each account to help users easily locate specific accounts. This coding system is crucial because a COA can display a multitude of line items for each transaction in every primary account.
For instance, a company may decide to code:
- Assets from 100 to 199
- Liabilities from 200 to 299
- Equity from 300 to 399
These codes can then be broken down further into categories like:
- Current assets (110-119)
- Current liabilities (210-219)
The number of figures used depends on the size and complexity of a company and its transactions.
A simplified version of the identification code system might look something like this:
| Number | Account Description | Account Type | Statement |
| 110 | Savings | Assets (Current) | Balance Sheet |
| 115 | Inventory | Assets (Current) | Balance Sheet |
| 140 | Property Plant and Equipment (PP&E) | Assets (Noncurrent) | Balance Sheet |
| 212 | Payroll due | Liabilities (Current) | Balance Sheet |
| 218 | Utilities | Liabilities (Current) | Balance Sheet |
| 250 | Long term loans | Liabilities (Noncurrent) | Balance Sheet |
| 330 | Preferred Stock | Equity | Balance Sheet |
| 422 | Sales | Income | Income Statement |
| 560 | Marketing Expenses | Expenses | Income Statement |
| 568 | Wages | Expenses | Income Statement |
Note how the coding system helps break down each listing into hierarchies and categories.
For example, all of the listings from 100 to 199 are assets, while all of the listings from 200 to 299 are liabilities.
Furthermore, anything from 100 to 119 is a current asset, while anything from 120 to 199 is a noncurrent asset. The same applies to 200 to 219 (current liabilities) and 220 to 299 (noncurrent liabilities).
This coding system can be further broken down into categories and details depending on the number of listings and how detailed the company wants the chart of accounts to be.
Many organizations structure their COAs so that expense information is separately compiled by department. Thus, the sales, engineering, and accounting departments all have the same set of expense accounts.
Examples of expense accounts include the cost of goods sold (COGS), depreciation expense, utility expense, and wages expense.
Visualizing a Chart of Accounts
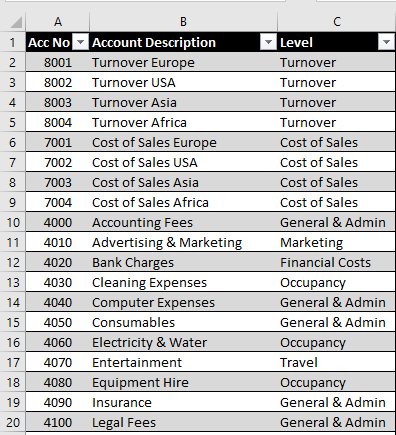
To understand the structure and format of a complete COA, it’s helpful to view an example. Below is a representation of a chart of accounts in Excel:

Adhering to Financial Standards
While COAs can be customized to reflect a company’s operations, public companies must adhere to the guidelines set out by the Financial Accounting Standards Board (FASB) and Generally Accepted Accounting Principles (GAAP).
Maintaining consistency in your COA from year to year is the most important thing when dealing with charts of accounts. This consistency ensures accurate comparisons of the company’s finances can be made over time.
COA Format
There isn’t a single, universally accepted COA format, but one word is key here: consistency!
Each company can use, create, or modify any format that suits its needs.
However, the most common format organizes information by individual account and assigns each account a code and description. Consistency in the format over time is vital for ensuring reliable period-to-period and year-to-year comparisons.
Is a Chart of Accounts Required?
While not legally required, a chart of accounts is considered necessary by businesses of all types and sizes. It helps categorize all transactions so they can be referenced quickly and easily.
Summary: What is a Chart of Accounts?
A chart of accounts is a crucial document that numbers all the company’s financial transactions during the accounting period. Information is presented in sections that correspond with the balance sheet and income statement categories.
The COA is a useful tool for providing detailed financial information to both insiders and outsiders, such as company employees, investors, and shareholders.
It is not just another piece of financial paperwork but a critical element of strategic financial management and informed decision-making.
How Datarails Can Help
The ability to collect, analyze, and interpret financial data is invaluable. Doing so in real-time is an even greater advantage, and that’s precisely what Datarails offers you.
Excel workbooks now connect directly to an organization’s consolidated data with Datarails Flex. With online workflows, automated reporting, budgeting, and forecasting can be completed in seconds instead of hours or even days.
Our user-friendly interface lets you organize and track all financial transactions in one centralized location. This makes it simple to generate accurate financial reports and analyze data over time.
Trust Datarails to streamline your financial management processes and give you peace of mind knowing that your COA is reliable and up-to-date.
Did you learn a lot about the Chart of Accounts in this article?
Here are three more to read next: