Did you know that there’s a financial modeling world cup?
For FP&A professionals and CFOs, that’s probably how they feel at the end of the monthly or quarterly reporting times. Because if there’s one thing accounting professionals know best, it is how to print a report, synthesize a table, and analyze data. And they do it all (monthly, quarterly, and annually) without the enticement of a world cup trophy.
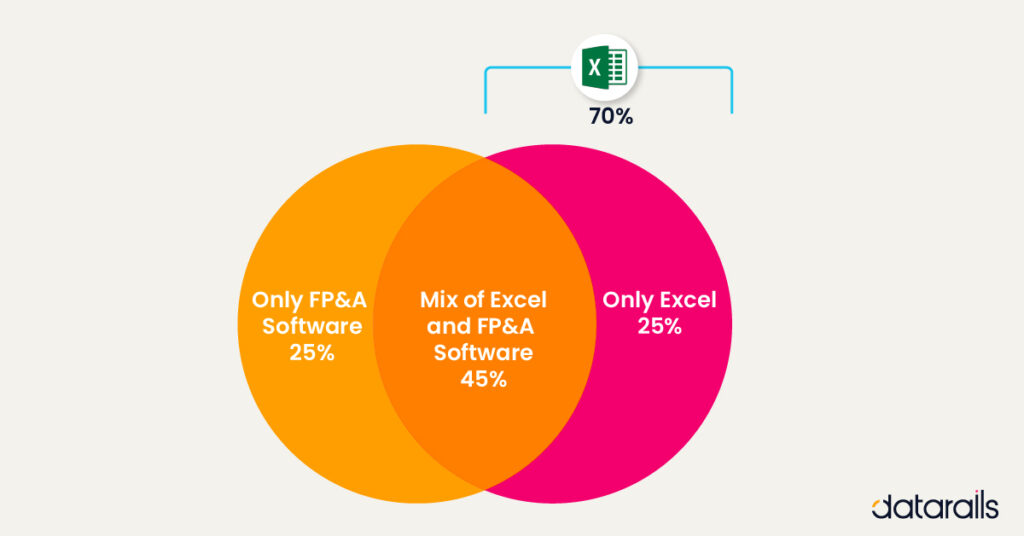
Today 70% of CFOs are using Microsoft Excel for their budget and forecast reporting needs, and Microsoft Power BI (Business Intelligence) has 5 million subscribers (as of 2016). So, how do FP&A professionals know which platform is suitable for them and their accounting needs?
Accounting pros, CFOs, and FP&A professionals know they don’t actually have to choose. There are ways to leverage each tool individually, in tandem, or even integrated with another platform to make financial reporting more manageable and accurate for you and your team.
Excel vs. Power BI: Functions Both Tools Have in Common
One of the main things Excel and Power BI have in common is they both take data sets and transform them into visualizations. And while the data modeling in Power BI is more complex than what’s offered in Excel, both platforms help streamline your FP&A functionaries with visualizing, modeling, forecasting, and reporting.
Some other standard functions users of both enjoy are tabular reports, charts and visuals, analytics, dashboards, integrations/connectivities, and utilities.
[wptb id=14620]
Excel vs. Power BI: How They Differ
While both products were made and released by Microsoft in 1975, they aren’t twins and are easy to tell apart.
Excel is a software application program available as part of Microsoft 365. Or you can install Excel for your iOS, Google, Amazon, and Android products. Why do we, as finance professionals, love Excel (aside from the spreadsheet aspect of it)? It’s simple; we love it because it takes our data and helps us glean insights from it.
Power BI (also available with Microsoft 365), unlike Excel, integrates with and pulls data from many different sources (software, apps, etc.) and allows you to visualize and connect your data in flexible ways.
Some of the significant differences between these tools are:
[wptb id=14629]
Excel and Power BI: The Verdict
Excel is a robust and flexible tool for analytics. When combined with Power BI, you get even broader data analytics and visualization powers. Together, they efficiently gather, analyze, and explore critical business data to help you make business decisions in fresh ways.
Excel: The Main Things to Know
70% of CFOs report that they are still using Excel for budgeting and reporting. It’s clear that, in the world of accounting, Excel is not going anywhere.
For small to mid-sized companies, Excel is a cost-efficient tool that can solve many of your reporting issues. Even larger companies still rely on the many benefits of Excel. Excel is the operating system of the accounting and FP&A worlds and remains the foundation for all visualization and analytic tools that came after it.
In a nutshell Excel is:
- Low cost. Your annual subscription to Office 365 includes Excel and other applications. A single license covers five computers, and business licenses are easy to acquire and cost a couple hundred dollars a year. Just like it was back in the day, the software suite is available for a one-time purchase.
- Easy to use. Excel functions are fairly intuitive and easy to learn. Plus, the standard templates save you effort and time. For example, you can use Excel templates for budgeting, payroll, timesheets, and more.
- Easy to integrate. Since it’s part of a suite of applications, Excel works seamlessly with other Microsoft business tools. This saves accounting and finance professionals time, as they don’t have to convert or export files before employing it with other software.
Power BI
If you’re a mid- to large-sized enterprise, relying on Excel alone for your budgeting and reporting leaves you open to human error. In the long run, the capacity for human error can cost your company millions because Excel is only as accurate as the data it has been fed.
Power BI is for more than just your basic visualization and analytics models. This tool takes all of your seemingly unrelated data and turns it into attractive visuals rife with insights. It serves larger enterprises best because of the capacity it has to take in large amounts of data from multiple sources. Other benefits include:
- More data sources. It’s easier to pull data from multiple sources. Excel isn’t set up for this — if you need sales data from X, marketing data from Y, site data from Z, and product data from A. Getting all that into Excel would be a nightmare and heavily reliant on manual entry. Power BI already comes with a data pipeline and integrates easily with multiple sources.
- Security. FP&A functionaries sharing data across multiple departments know it’s difficult to control access to spreadsheets. With Power BI dashboards, access is easier to control and data is easier to refresh in real time. This is ideal for bigger companies with subsidiaries reporting monthly, quarterly, and annually.
- Better visualization. Graphing is quick and easy in Excel, but getting everything to look nice in a dashboard style isn’t. This is what Power BI is set up to do.
Next Steps: Excel, Power BI, DataRails, and You
Being a master of Excel comes with the FP&A professional territory. And, until now finance was the only arena BI technology hadn’t penetrated. But with both Excel and Power BI – now you can become a reporting ninja.
In the past, finance Software was abandoned by FP&A and accounting teams because it did not meet their specific needs. DataRails is the first-ever self-service BI solution for finance and it uses what you know best – Excel.
Make reporting, analyzing, and data collection even easier with DataRails — an FP&A software solution built for finance professionals. DataRails easily integrates with both Excel and Power BI (the two things you’re probably already a world cup champion in).
If you’re ready to leverage these tools or to up your reporting and forecasting game, request a demo.
[wptb id=14631]