The world is moving forward, but some are left behind
Technology adoption refers to the acceptance, integration, and use of new technology in society. A typical adoption cycle involves the following segments:
1. Innovators develop a technology
2. Early adopters test and begin using it
3. The early majority and the late majority represent the bulk of users
4. Laggards adopt a technology last
If we look at different organizational departments, we typically see sales, marketing and R&D falling into the categories of early adopters or the early to late majority.
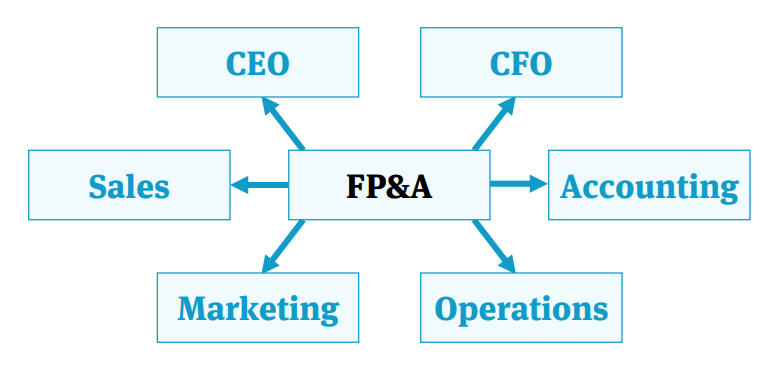
On the other hand finance, and particularly the FP&A function, is always a laggard.
While the finance department leads the direction of an organization, the function hasn’t seen much change over the years. Teams today rely heavily on Excel, just as they did some twenty years ago. Instead of leveraging the power of the large datasets available today, data analysis and business insights still depend on individual knowledge. This raises the following questions:
Why are identical processes in different departments handled differently?
How come when a marketing professional needs to understand his data he
can turn to a dedicated system, while the FP&A professional goes to his ERP, exports data manually, and loads it into Excel?
One standout reason is that finance professionals prefer to rely on methods of work they feel they simply can’t live without. However, in a world where data and analytics are increasingly merging with organizational functions, finance has much to gain.
In this eBook, we’ll be covering the role of FP&A, why Excel is such a critical part of it, and what new finance tools have to offer.
In a world where data and analytics are increasingly merging with organizational functions, finance has much to gain

A Sweeping Portrait of FP&A
As part of the FP&A function’s monthly or quarterly efforts to produce income statements, balance sheets, cash flows and basically any monthly reporting package, data is exported from various systems. This can be data from an ERP, CRM, GL, HR data, etc.
After downloading CSV files, data is copied and pasted into spreadsheets.
Usually, additional data that comes from other spreadsheets that were filled in manually such as forecasts, budgets, etc. is added.
Lots of time is spent manually consolidating data sources into one dataset, and this process is repeated often.
Once all data is consolidated, it is manipulated and prepared for final reporting.
Lastly, the little to no time left is spent on the part with the greatest added value-analyzing data, trying to understand the obstacles standing in the company’s way, and identifying what can help the company excel.
A glance at other departments
How do other departments do it?
Marketing
Marketing gets data from sources like Facebook and Google, crosses it with analytics data, combines it with data from their CRM, and finally generates insights.
Sales
Sales gets data from their CRM and compares it with forecast spreadsheets to understand where they stand against company goals and so on.
It doesn’t take much to realize that these processes are identical to those of
the finance department.
But, there is one huge, huge difference.
The BI difference
BI platforms enable workers to take data from different sources, manipulate it, and create sexy dashboards that visually represent data.
Unsurprisingly, most of finance’s peer departments are using this tool.
Why does finance continue to rely on Excel and spend so much time tying out all the numbers and making sure they’re accurate, despite the existence of BI tools?
BI is a platform, not a solution
The BI product was created as a horizontal platform to deal with data. It was not created as a vertical solution to address a specific need.
While marketing, sales, and other departments require basic data manipulation capabilities, for finance it’s a different game. FX conversions, variance analyses, and intercompany eliminations? Building such capabilities on a standard BI platform requires massive effort from your IT or BI team, which can take months.
Flexibility
Much has been written about why Excel is the past, present and future of finance. Always, the flexibility of Excel is what makes the difference.
BI platforms are able to cope with enormous amounts of data and have stunning dashboards and collaboration features that Excel will never have. But at the end of the day – they don’t offer the flexibility of Excel, and will never allow finance professionals to do all that they need to do in order to validate a specific assumption, or to add just one more validation to make sure reports
are correct.
Complex Excel Files
Every organization stores a significant portion of their organization’s financial data on spreadsheets, such as forecast reports that are collected from different departments, budget data, P&L etc. These spreadsheets can’t be uploaded into typical BI systems.
While they work great with structured excel files (a CSV format if you may), a BI system can’t work with a P&L spreadsheet or forecast data scattered around numerous files with different structures.
Even if you’ve built the perfect financial solution on your BI platform, you won’t be able to incorporate your spreadsheets into it. This forces you to use Excel once again in order to consolidate data, and that just brings you back to square one.
Requires IT/BI help
No one wants to be at the mercy of the IT or BI department and their prioritization. And in the BI world, IT is king-they’re the only ones who can help when there’s a missing column or any other issue.
When producing monthly or quarterly reports, finance professionals are under a lot of pressure. A mixture of tight deadlines and changing management requirements don’t leave time for any unplanned technical issues. Since no one wants to miss a deadline or deliver partial reports, finance professionals tend to simply rely on themselves and export data manually instead of turning to
the IT or BI team.
Why are other departments using BI?
If BI has so many downsides, how come every department is using it except finance?
- Marketing and sales data is much simpler than the data finance deals with.
- Their core systems are more advanced and have built-in integrations for BI solutions, unlike ERP systems that are often heavy-duty and old-fashioned.
- Management is usually more willing to invest money to get sales insights and to improve marketing.
Marketing Analytics
That being said, what seems to be the best explanation for what we’re seeing is the existence of department-specific tools.
For example, let’s look at the marketing analytics vertical – which has been one of the fastest-growing BI verticals in the past few years and consists of platforms such as Supermetrics, funnel.io, and Datorama (acquired by Salesforce). All of these successful companies target one specific
department- marketing.
Their advantage lies in the fact that they address the gap between marketing needs and typical, horizontal BI solutions. They created a vertical BI solution that offers out-of-the-box connections to marketing systems and built-in marketing reports and KPIs.
Are typical CPMs the solution?
Adaptive Insights, Prophix, and Host Analytics are all financial planning and analysis solutions, alternatively known as CPM solutions. They’re all great products that deliver great analytics capabilities.
However, CPM solutions are quite different from BIs.
CPM solutions are first and foremost meant to replace your existing processes, which entails a lot- setting up new processes, training, building new models, etc. For FP&A, this means replacing all existing processes and models with new logic, which is a pretty big deal and can take up a lot of time and resources.
Yes, once this sort of system is in place, it does deliver. But getting to this point
involves lots of change and resource allocation.
The BI difference part II
The idea behind BI is that it’s a solution that is placed on top of your existing solutions and processes and enables you to get business insights without changing your processes. It’s essentially a plug and play concept.
If for whatever reason it fails to work, it doesn’t affect you in any way-you
continue to work as usual.
Finance is overlooked, unnecessarily
As previously covered, the marketing analytics solution is an amazing concept that takes the good of BIs and leaves behind the problems that typically come along due to its horizontal approach.
This brings the following questions to mind:
- Why isn’t there such a solution for finance?
- A financial analytics solution that meets the needs of finance departments, much in the same way that marketing analytics meet the needs of marketing?
- A platform that connects seamlessly to your systems and allows finance professionals to work with their data, but on their terms?
- One with strong financial data preparation capabilities like consolidations and lookups, and with the financial manipulation abilities such as FX conversions, intercompany eliminations, and financial adjustments?
- A tool that lets you prepare and analyze data with variance analyses, drill-downs, and ad-hoc reporting?
There is.
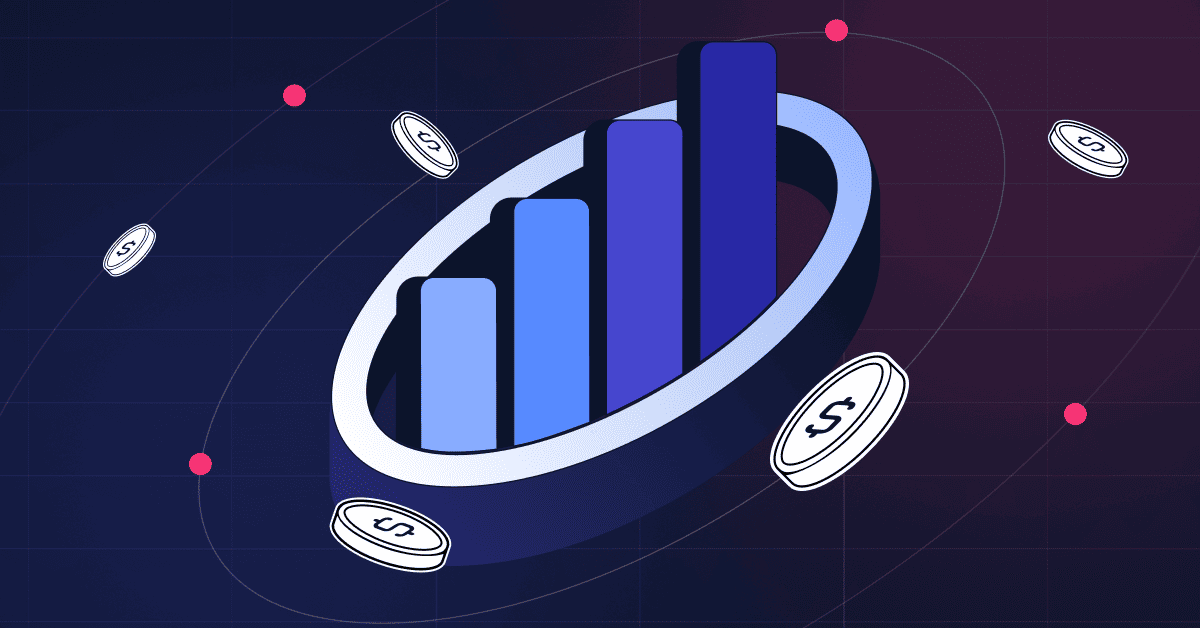
Unlock insights with financial analytics
Drive superior decisions with the financial BI designed just for you.
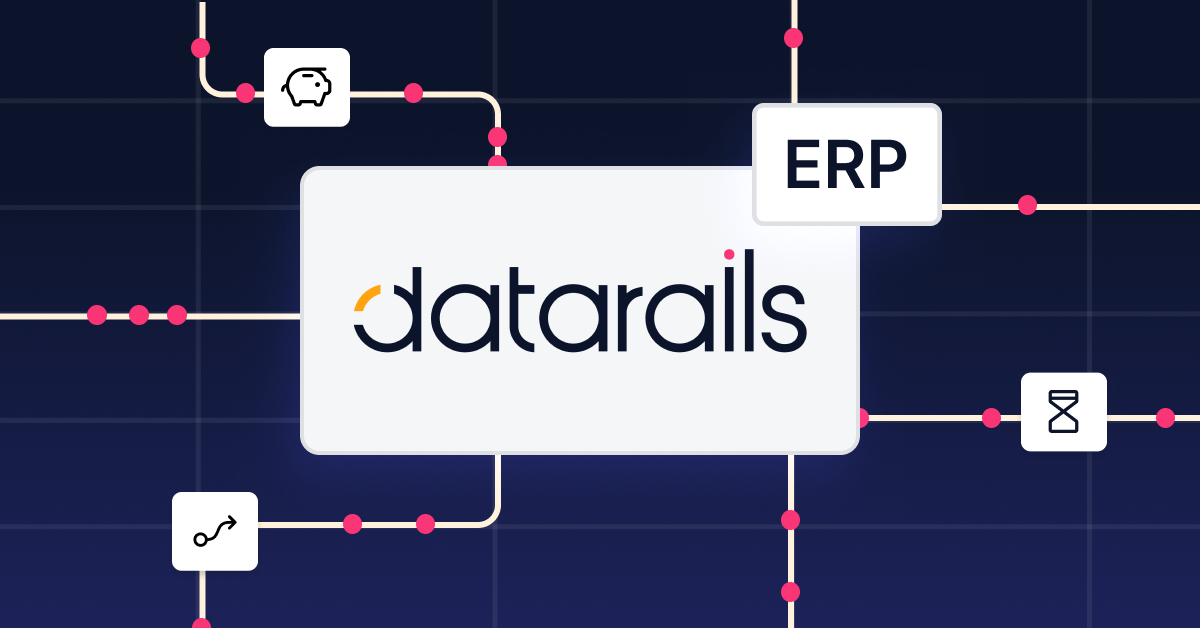
Datarails, an augmented intelligence platform that empowers each finance professional to independently work with data, is the financial analytics platform you need to know about.
Say goodbye to data silos with the turnkey solution that lets you quickly and easily work with cross-organizational data on your own. Uncover actionable insights in four simple steps:
- Gather | Centralize scattered financial and operational data from all your organizational platforms in one place. Bring together data from any ERP, GL, CRM, or any other transactional system, as well as data from spreadsheets of any structure or template.
- Prepare | Benefit from improved data preparation with automated data transformations including consolidations, FX conversions, eliminations, hierarchies, financial adjustments, and more.
- Report and Visualize | With a complete set of data and Datarails’ Insights feature, create clear visualizations and reports to help executives see what they need to see within the Datarails visualization tool OR the familiar and powerful environment of Excel.
- Analyze | Perform advanced investigations into your data including variance, horizontal, and vertical analyses. Slice and dice data, drill down, and perform adhoc analyses to discover and provide insights to guide business decisions.
Powerful Financial Analytics. Real Results