Improving financial reporting is a must.
A recent CFO survey found that 85% of CFOs believe that while they have access to the data they need, they spend too much time gathering data, checking for accuracy, and putting together reports.
What can be done? In this article, we’ll look into how finance teams can set up and benefit from automated reporting to provide decision-makers with all the information they need to make optimal business decisions (this can also be done by looking at your spend analysis).
The challenge: processes are slow and manual
Spreadsheets are the bread and butter of financial reporting. But while they’re the basis of every financial reporting process, oftentimes they can be the source of slow manual processes- copy-pasting of numbers in order to consolidate data can take up lots of time. However while there may be novel dedicated systems that require moving off of Excel, there’s no chance we’ll see FP&A analysts and other finance professionals giving them up soon.
There are a few good reasons why 85% of the market is still relying on spreadsheets:
Flexibility
Excel is incredibly flexible when it comes to model creation. Every company is unique, and each one has built financial models over the years that help them perform better. A company that has been holding its budget/forecast process on spreadsheets for years has built their financial IP (Intellectual property) into their spreadsheets. To switch to another system, organizations often have to let go of their models and move to a model within the new system. Or, they spend lots of time and money to create their existing models in the new system. And even after adopting a new system, chances are that finance professionals continue using Excel for various analyses given its simplicity and ease of use.
Implementation Time
Implementing a new system can take lots of time, anywhere between a few months to over a year. And often, even after implementing a new system we see the process failing and companies going back to working with spreadsheets.
Excel is an integral part of most departments within an organization, particularly finance. Its simple user interface makes it easy to understand and use, and years of usage within organizations has fostered a hard-wired dependency amongst users.
Cost
Budgeting / forecasting software is usually expensive and can cost around dozens of thousands of dollars per year for a Small/Medium Enterprise.
An important aspect of the cost is implementation – implementing a financial reporting software usually costs a couple of dozens of thousands of dollars, and sometimes costs just as much as the software itself.
Support Over Time
Models and business requirements change over time. Dedicated systems don’t allow for enough flexibility – often the customer has to ask for updates to the models, which can cost lots of money and take up lots of time. But more often than not, customers end up going back to Excel. So after spending so much time, money, and effort on a new system, finance professionals often find themselves going back to where they started – relying on Excel.
The Solution
With Datarails, finance work remains unchanged as professionals continue working with their original Excel spreadsheets as they’re used to. Users benefit from an enterprise-class platform at the same time that they continue using their original Excels without running the risk of inaccuracy, unnecessary errors, or data loss. With Datarails, Excel is enhanced into a database-centric organizational solution.
Datarails’ patented technology consolidates and stores all Excel-based data on a cloud-based centralized database. Datarails allows you to keep working on your existing reports as you’re used to while connecting your original Excel spreadsheets to a centralized database. With all your data connected, pull information in real-time from your systems. Finance professionals optimize processes with automation, all without changing the way work is done. Slow, manual processes are replaced with fast, automated ones.
The Challenge: The need for a single source of truth
Spreadsheets are often passed around from person to person, as each person adds their bit or makes a change here or there. Files are shared with and edited by different people within an organization, making it very difficult to track the most updated file.
When there isn’t a centralized reporting system, there tend to be inconsistencies in the numbers, data, and calculations – which means the finance team has to sift through all the data and decipher where things went wrong in order to fix it.
If the numbers that reach the c-suite can’t be trusted, will executive decisions be any better than a best guess? The single version of truth is buried somewhere in multiple files, hidden by multiple adjustments and clouded by errors.
What if you could take what your team already knows- the tools you’re using today – and augment them? What if you could adopt built-in features and functionality of groupware collaboration? What if you could ensure that multiple users always work with the latest version of a shared file?
The Solution
Datarails supercharges Excel spreadsheets to drive productivity and collaboration. Datarails gives finance professionals ongoing access to collaborative files, while ensuring they always work with the latest version.
Datarails makes collaboration between finance and various cost centers easier and more effective. When disparate managers want to update finance on any changes to their budget, all they have to do is click “save” in the Datarails ribbon in Excel. This automatically consolidates spreadsheet-based numbers in the Datarails centralized database and notifies management of changes.
Numbers from spreadsheets are automatically made available and can be compared with actuals pulled from any ERP. By granting access to previously inaccessible numbers, the system facilitates collaboration, communication of budget progress and status, and accurate reporting that relies on shared data. This all leads to better and more accurate decision-making.
The Challenge: Integrating data from multiple systems
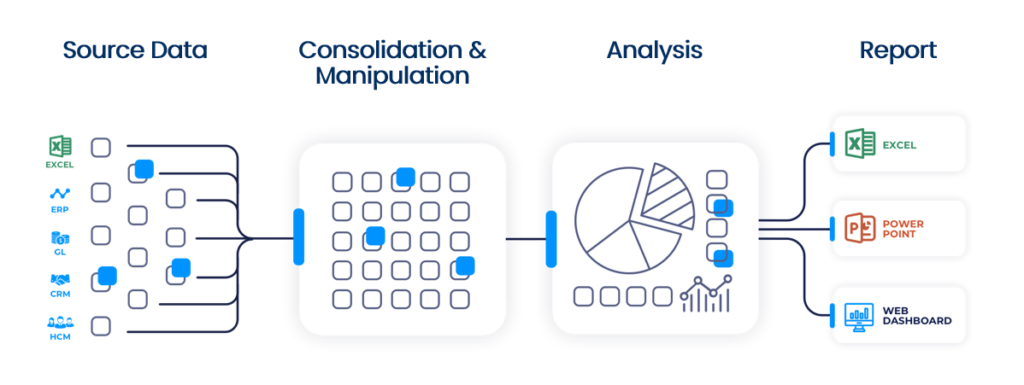
To effectively track performance in your business, decision makers need to monitor information that comes from a diverse set of sources- ERP, GL, CRM, sales data, etc. Many finance teams rely on spreadsheets to manually aggregate data from disparate systems to create one source of information. This tends to be slow and error-prone.
The Solution
Datarails automatically consolidates your information from across organizational systems. This includes all your financial and operational data from all your complex Excel files alongside data from any transactional system (ERP, CRM, HRIS, etc.) No matter how complex your data, Datarails is able to bring it all together and create one unified, structured database. Even if your data is stored on an old system with no API connection, Datarails can connect your system using RPA. So have no fear- you can access and consolidate your data no matter where it is stored.
Data can be drawn on a daily, weekly, or monthly basis, or on demand. Once it’s all brought together, users can draw upon any piece of information they need to extract insights.
The Challenge: Spotty data integrity
Finance departments rely on vast amounts of data, all managed in Excel spreadsheets. The importance of data accuracy is clear, and yet it is still allowed to be subject to something as uncontrollable and unpredictable as human error. One mistake hidden in thousands of rows of data can influence bottom line numbers and official reports in public companies, and mislead important insights.
It’s no wonder that professionals in the finance industry are concerned.
The real issue is, there is no good alternative to Excel. And the matter of fact is – finance departments, organizations, and professionals will undoubtedly continue to use it. So, what can be done to improve data integrity?
The Solution
With Datarails you don’t just get a story- you get the whole story. View the full history of a cell in Excel, including values and formulas that have changed over time.
Count on one version of the truth, and trust that it will help you make the right decisions. Finally, you can understand where your numbers came from and trust that they are accurate.
- With Datarails, take advantage of full version control- database all versions of your workbook to see different dimensions of your data and compare versions.
- Examine logical comparisons- Datarails is unique in that even if you change the structure of your Excel, it tracks these changes.
- Take a look at the full history of a cell: A cell-level audit trail shows you how values and formulas changed over time.
- Logically compare any two versions of a spreadsheet from any point in time.
- Count on one version of the truth, and trust that it will help you make the right decisions.
The Challenge: Lengthy Analyses
Financial analysis involves evaluating businesses, projects, budgets, and other finance-related transactions to determine performance and outcomes. To conduct analyses, finance professionals first need to gather information from across the organization in order to conduct cross comparisons like quarter to quarter evaluations and compare Actuals vs. Budgets.
To conduct the comparisons you’d like to make at a granular level, it can be tricky to get to the data you need exactly in the way you want it in order to examine what you want to see. Getting the data segmented the way that you’d like can be tricky, lengthy, and burdensome.
The Solution
With DataRails you can clearly and easily define the data you’d like to capture- for
example particular periods of time, particular products, or particular departments- in order to compare them to one another or bring them together. Easily bring together data and sub-categories of your data in the best way possible in order to easily conduct analyses.
Datarails offers a next-gen financial analytics solution that can help you quickly analyze and understand the current state of your business, spot variances, and respond dynamically with best actions. With Datarails, connected teams can conduct what-if scenario planning and collaboratively decide how to make up for shortfalls, seize emerging opportunities, and avoid pitfalls.
And with Datarails, organizations are able to leverage ALL organizational data including unstructured data that is spreadsheet-based, all of which is consolidated on the cloud and made instantaneously accessible and ready for analysis.
With data from all corners of your business centralized in one place, exercise drill- downs to the lowest level line-item in order to extract insights that were previously inaccessible.
What’s really needed to respond to rapidly changing conditions with agility is a platform that can tie together the data, the people, and the plans to maximize visibility, and Datarails does that.
The Challenge: To assemble meaningful management reports
To deliver a solid management report, information first has to travel down a funnel. In goes all the data pertaining to company performance and strategy. Once you’re done with it, out comes a simplified, coherent message. But given the sheer volume of data that exists today, narrowing it down to be presented to management can be a challenge. How do you get decision makers to see what they need to see?
The Solution
Datarails allows you to create management reports and presentations that visualize your numbers without leaving the Excel platform you know and love. Directly feed data to Excel or Powerpoint, or vice-versa- Datarails’ unique Office-native integration pulls data from your unified database to Excel or Powerpoint.
Within their powerpoints, the C-suite can drill down into the numbers in order to independently examine figures and understand the business. With a click of a button, watch as live embedded charts update figures on the spot, in real-time. This way, the c-suite can always be confident that they’re working with the most updated numbers.
Filter through your data to generate reports that meet your specific needs. All your data is consolidated in one place, just select what you want to see. Thanks to Datarails, watch your data transform into live charts with embedded, real- time visualizations. Compare any two or more metrics to better understand trends and cross-influence metrics. Create monthly managerial packages instantly that will be populated automatically for each month-end and send them to stakeholders.
From Reactive to Proactive
With Datarails, uncover actionable insights in three simple steps:
1. Consolidate your data and automate financial processes
Automatically centralize scattered financial and operational data from all your complex Excel files alongside data from any transactional system (ERP, GL, CRM, etc.) Benefit from improved data preparation with automated data transformations including consolidations, FX conversions, hierarchies, financial adjustments, and more.
2. Extensively analyze your numbers
Perform advanced investigations into consolidated data including variance, horizontal, and vertical analyses all within the familiar environment of Excel. Slice and dice data, drill down, and perform ad-hoc analyses to guide business decisions.
3. Prepare automatic reports and visualizations with ease
Produce financial reports such as profit and loss reports, balance sheets, and cash flows with real-time figures drawn from your databased numbers. Feed data directly from your centralized database to Excel, Powerpoint, or Datarails’ Insights feature and refresh charts and figures with one click.
Unlock insights with the FP&A solution for Excel users.
Datarails helps you take control of and automate Excel-based processes without changing the way you work.
A graduate of Microsoft’s accelerator, Datarails’ patented spreadsheet management platform ensures security, traceability, backups, version recovery, and regulatory compliance. Datarails consolidates and provides instant insights into your data, all within your current Excel environment.
Centralize
Gather all scattered financial and operational data from all your favorite platforms in one place. ERP, GL, CRM, and spreadsheet data included.
Transform
Perform variance, horizontal, and vertical analyses. Slice and dice data, drill down, and perform ad-hoc analyses to discover actionable insights.
Understand
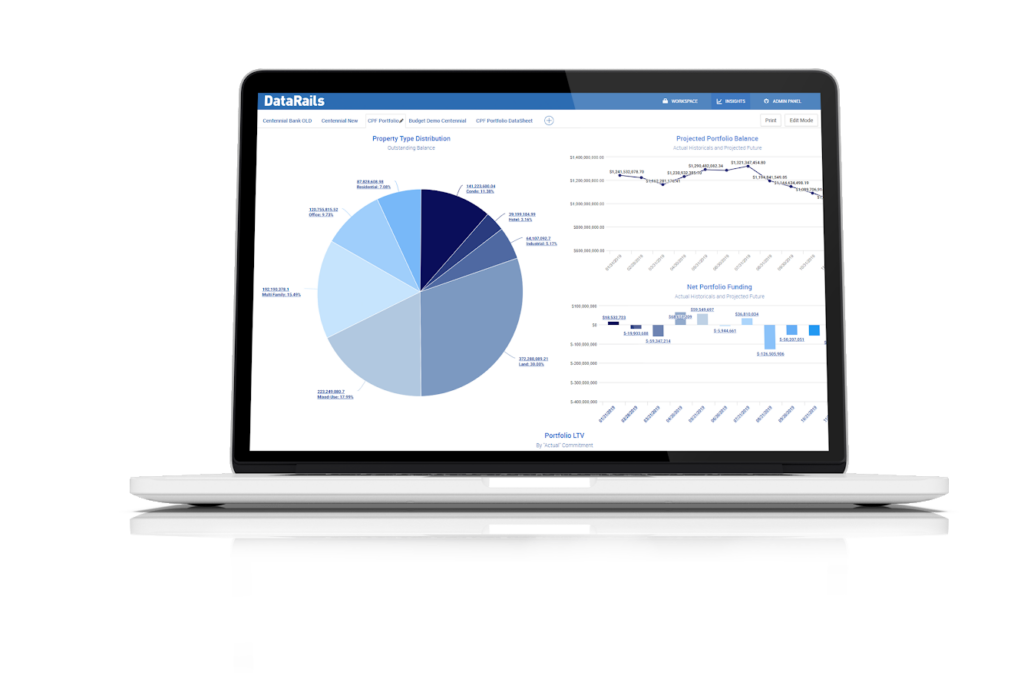
Create clear visualizations with Datarails’ Insights feature to help executives see what they need to see.