What is a management report? Why is it so important?
The goal of management reports is to arm management, decision makers, and the c-suite with all the information they need in order to make strategic business decisions. Data is collected from various departments, functions, and cost centers across an organization through ERPs and CPMs. Key performance indicators (KPIs) are tracked, monitored, and presented.
Financial management reports are similar to financial reports in many ways. However, they are often presented differently, for example through the use of financial dashboards. Financial management reports are important for keeping track of the numbers and presenting data to decision makers.
Financial management reporting provides insights on how an organization is functioning and helps guide an organization towards the right path of decisions.
Datarails makes it easy to report on key KPIs and present management with a financial management report that is tailored to their requests and needs.
What are the benefits of frequent management reports?
The key benefit of frequent management reports is the ability to make up-to-date data available to decision-makers at all times and places. This will help drive the company forward, especially during uncertain times like these. The CEO has to deal with lots of information coming from various sources and aspects of the business. Management reports are therefore utilized to make his life easier and to help with the decision making process. They allow the CFO and finance department to report on the areas of business that the CEO is interested in examining or alternatively reflect areas of the business that need to be addressed.
What information does financial management reporting consist of?
Each organization’s management report is a bit different, as management can want to see different numbers and perspectives of the data. However to start, some basic figures that are often represented include the budget and cash flow, as well as more complex metrics such as wage to revenue ratio or client to job profitability.
Consider including the following details in your management report:
Profit & Loss
- Comparisons – compare P&L variances to examine where you’re over or under spending
- Analyze different departments – segment your P&L according to department to examine profitability
- Cost of sales – look into total expenses which might consist of elements such as production and materials
Cash position
- Budget – plan where and how to allocate money in different areas
- Examine historical cash figures – compare current with previous cash positions to examine if the business is generating profits
- Dive into the organization’s assets vs. debts
According to a Deloitte survey, top management expects the role of the finance function to evolve from providing pure financial information towards providing real insight based on an appropriate gathering and analysis of credible internal & external, finance & business information.
The survey reveals that today’s reporting is very much focused on financial information, with about 45% of the reported information being related to the company’s financials and financial ratios. However, top management expects its reports to go more and more beyond the pure financial information by significantly increasing the share of business-related information over the next 3 years. This shift in content enables top managers to be better aware of the context and the main business drivers behind the financial results which is essential to steer decisions.
What types of management reports exist?
There are a few common variations to the management report that exist.
The first is the budget report. Budget reports are crucial in helping finance measure company performance. The budget report lists earnings and expenditures of the organization. By examining these numbers, managers can determine if expenditures are in-line with expected budgets, and if not they can plan steps and actions to reduce them.
A cost managerial accounting report is another popular report. All costs- including raw materials, overhead, and labor- are taken into account and divided by the amounts of products produced. With this report, profit margins can be calculated and monitored.
Management reports can also be customized to show managers the particular stats and figures they’re most interested in.
Financial report vs. management report
While both financial and management reports report on the numbers, there are a few key differences between the two.
- These two reports differ in their target audience – financial reports are typically for external stakeholders such as regulators and investors. On the other hand, management reports are for internal use. This means they’re oriented towards the needs and interests of top management and the CEO – the decision-makers within the organization.
- Financial reports are mandatory and are used to keep external stakeholders in the loop regarding what’s going on in the business. Financial reports must adhere to standard reporting guidelines. On the other hand, since management reports are optional and are used internally within the organization, they don’t have to adhere to any specific format or template.
- Financial reports reflect the company’s overall performance for a given period of time. Management reports, on the other hand, are less holistic. Instead, they tend to segment data and hone in on a particular slice of the data pie. For example, it may examine the P&L according to department or function.
- Financial reports tend to face the past – they look at how a company has performed. On the other hand, management reports are meant to assist managers in looking towards the future- their role is to help make predictions about future performance and growth.
A few words about the monthly management report
It’s important to keep in mind that, as mentioned earlier, management reporting, unlike typical financial reporting, is for internal use only. It’s not mandatory, and therefore doesn’t have to follow any standard rules or regulations. Instead, finance professionals can choose to reflect whichever metrics they deem important and relevant to management in the report. Management reports allow professionals to dive deeper into the numbers and explore different segmentations and periods of time.
What are the challenges each CFO encounters when it comes to creating or presenting management reports?
The greatest challenge for creating management reports is finding the time to do so. Management reports are excellent for digging deeper into figures and helping management better understand the numbers. But when so much time is already spent creating the regular/required financial reports, how do you find the time to create extensive, relevant, timely, and accurate management reports as well?
Another challenge is getting all the information together. Yes, you may have set some time in your calendar to spend on rounding up the numbers. But more often than not, getting the numbers means reaching out to different people and department heads and waiting on them to send over the relevant information. This can take time, and there isn’t much that can be done to speed up others in delivering.
Additionally, management often has questions regarding the numbers they receive in their reports. For example- where did this figure come from? What is the reason behind this figure? Finance professionals are often left without words as they simply don’t have the answers. While they were able to put together the management report, they often aren’t able to provide solid, accurate responses to questions that arise, as this requires going back and re-examining the data and often producing relevant ad-hoc reports.
The advantages of creating management reports with Datarails
With Datarails, creating management reports is quick and easy. A management report that fits managements’ interests and needs is generated once and once only. After that, an automatic management report is generated at the end of every month with the click of a button. These monthly managerial packages are instantly populated automatically and are ready to be sent to stakeholders.
Thanks to Datarails, data gathering from various departments and sources and financial data consolidation is made easy and effective. When disparate managers want to update finance on any changes to their budget, all they have to do is click “save” in the Datarails ribbon. This automatically consolidates spreadsheet-based numbers in the Datarails centralized database and notifies management of changes. So, instead of having to chase after people to get them to email in the latest numbers, all they have to do is click on one button.
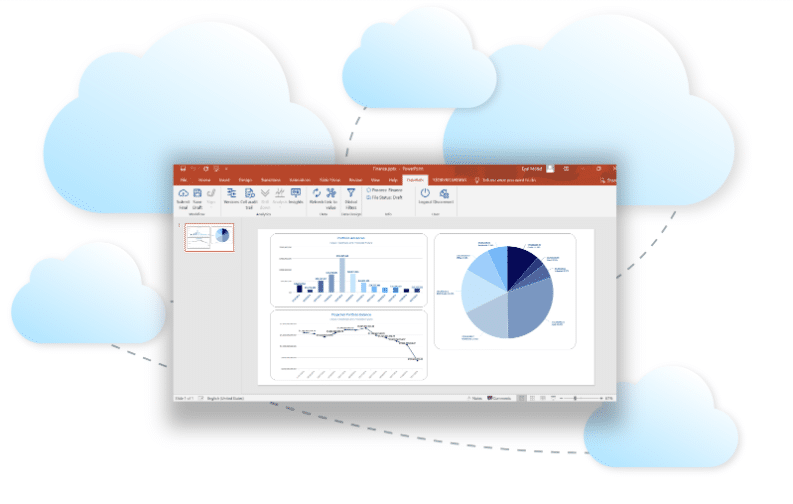
Datarails allows data to feed directly from your database to a Powerpoint presentation. What does this mean? This means that a monthly reporting package in Powerpoint can be refreshed with the latest numbers with one click.
What about answering questions from management? Finance professionals need to be prepared to answer a wide array of questions regarding business data, and with Datarails they can be. Finance professionals can bring management reports to life by drilling down and filtering through graphs and charts directly in the PowerPoint deck. Now when management has a question, their interests and concerns can be addressed on the spot.
About Datarails
Datarails is an FP&A solution that allows for the connection and centralization of all organizational financial data from various systems (ERP, GL, CRM) alongside Excel spreadsheets and operational data. It also allows for the creation of automated reports (P&L, cash-flow, budgets, etc.), as well as a thorough analysis of consolidated data for the creation of business and financial insights.