
OLAP is an acronym for Online Analytical Processing, which is a method of organizing and visualizing data that is made available from many different sources simultaneously. This is in contrast to OLTP (Online Transaction Processing), which is often used as part of OLAP and includes transactional data that OLAP uses to make forecasts. OLAP software is a result of modern advancements in data processing and warehousing, which has created environments ripe for advanced data aggregation and dissemination. It allows users to extract and analyze data from across an organization in various ways.
What Is the OLAP Cube?
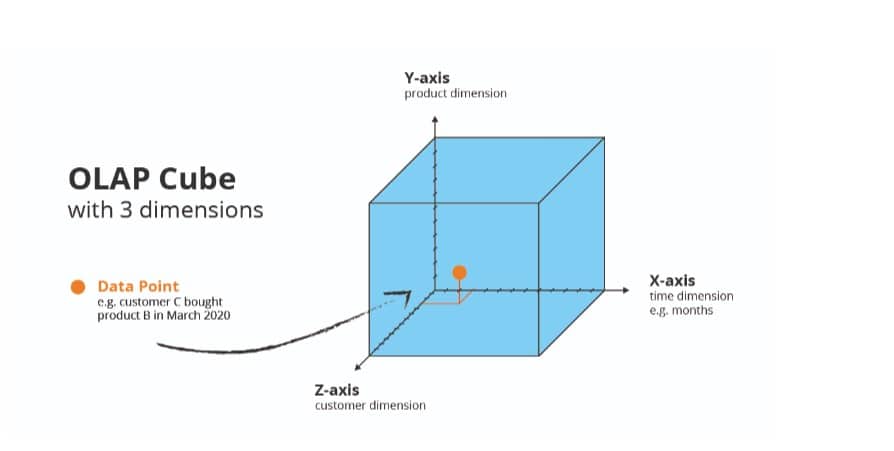
The basis of OLAP database design is in the geometric cube, often referred to as an OLAP Hypercube. OLAP databases are usually divided into one or more hypercubes that are designed in a way to ease the creation and viewing of reports. Each cube is comprised of numeric facts, referred to as “measures,” that are then categorized by various dimensions.
The most common environment for data visualization is in Microsoft Excel, where each sheet is defined by rows and columns. This is often referred to as “two-dimensional” data. The data produced by OLAP software is commonly called “multi-dimensional” because it is obtained from different and often unrelated sources and is not bound by rows and columns, but rather defined by the hypercube structure, which is three-dimensional.
An example of an OLAP cube would be sales data that reflects date parameters, product categories, and territories, allowing for each of these data sets to be aggregated and dissected in their own way.
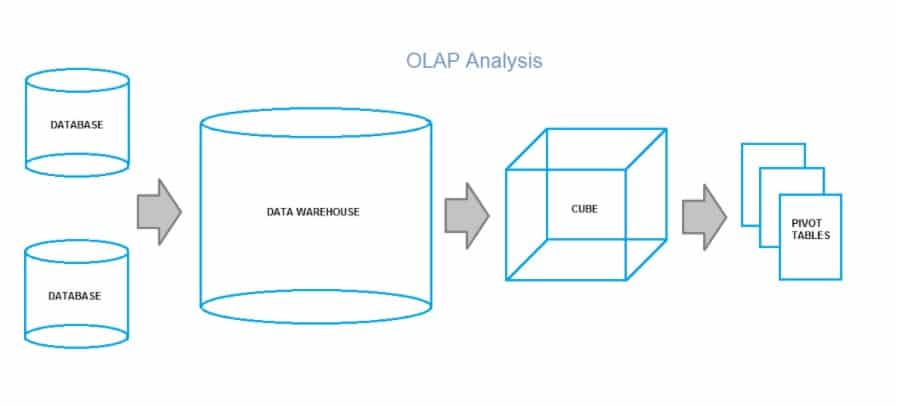
The process of aggregating data in an OLAP is relatively simple to understand. Data is aggregated in various forms in a data warehouse where it can be extracted and transformed. It is then loaded into an OLAP cube where end-user information is presented, typically pre-calculated.
How to Use OLAP
Practical Applications of OLAP in FP&A
There are four primary analytical approaches to analyzing data presented in OLAP software:
- Consolidation and aggregation
- Drill-down
- Data slicing and dicing
- Pivoting
Each of these analytical approaches can be used separately or in conjunction to approach effective FP&A (financial analysis and planning).
1. Consolidation and Aggregation
Depending on your budgeting methodology, it might make sense to employ the use of data consolidation. For example, in a top-down budget model, it might make sense to aggregate data for a single department that spans multiple locations. This would allow senior management to make their specific allocation to a department and thus allow the department to design its own budget without the burden of having to comb through each location’s data.
2. Drill-Down
One benefit of OLAP software over spreadsheets is the ability to drill-down quickly and easily into data that is presented in a homogenous way. This is especially helpful when performing FP&A across multiple locations or sites. This type of analytical approach can be especially helpful while reviewing things like revenue and expenses. For example, if a user is reviewing revenue across multiple sites and locations, drilling down into the data might be extremely helpful to identify ways to maximize profitability. While a company might be profitable overall, each location needs to be profitable, so drilling down into data might expose those sites, products, or even times when profitability is at its lowest.
3. Data Slicing and Dicing
Slicing refers to a process where one dimension of an OLAP cube is selected and a new cube is created based on the data point that is being “sliced” out of the original cube. Slicing is somewhat synonymous with “filtering” data based on a single parameter. This is helpful when analyzing things like sales during a particular time of the year. For cyclical businesses, this might be extremely helpful in identifying locations or product categories that do well in each of the fiscal quarters, which in turn can be used to develop more adept marketing strategies.
Similar to slicing, dicing refers to a process where 2 or more dimensions of an OLAP cube can be selected and a new cube created based on the data points being “diced.” Again, similar to slicing, an end-user might be interested in filtering an OLAP cube to reveal which product categories experience spikes in volume during specific quarters. This type of data analysis can be extremely helpful while performing inventory planning.
One benefit of having multidimensional data available is that you can perform techniques like slicing, dicing, and drill-down simultaneously. This allows for an extremely comprehensive approach to data analytics that traditional excel sheets simply cannot provide.
4. Pivoting
Data pivoting is likely most commonly connected to the use of “Pivot Tables” in Microsoft Excel. The same concept applies to OLAP software, where data axes are rotated, or pivoted, to provide a new presentation of the same data.
In data analytics, pivots are often used for presentation purposes, whereby rearranging data sets helps to identify trends or present data in a more concise manner.
When to Use OLAP?
An OLAP application is suitable for any business type and can be used in various types of financial reporting, planning, budgeting, and analysis. When utilized appropriately, there can powerful reporting benefits attained. Those reporting benefits, in turn, can be massively helpful to any organization that wants to become more efficient and more effective. It can also help identify opportunities for improvement and growth.
Because an OLAP requires organizing data into complicated schemas, it is important to analyze and verify if an organization is capable of successfully implementing OLAP software. It is also important to understand what an organization is looking to achieve by implementing an OLAP application as transactional data cannot be accessed with OLAP software, and an OLAP cube is not able to hold large numbers of dimensions.
However, an OLAP application and be extremely beneficial for an organization that has an already-cumbersome budgeting and planning process. Any organization that is housing data across scattered spreadsheets and various formats can benefit from the implementation of an OLAP application.
Because the information and calculations are all static and consistent across OLAP cubes, it allows users to easily dissect data according to their needs. OLAP databases are typically easy to query and can provide great visualizations, allowing for faster data usage. As many organizations know, data is not much use unless it is timely, and too often, data takes so long to aggregate and analyze that it becomes almost worthless for forecasting, and instead can only be used to understand the past. Faster data usage equals an enhanced ability to make the most out of the data at hand.
Any organization that is looking to boost its ability to build business models, perform advanced data mining, and enhance performance reporting should consider the practical application of an OLAP system. Due to their design, they are inherently good for analyzing data defined by time and performing detailed “what-if” scenario building, a task that is critical to any organization looking to reach new heights.
Spreadsheets VS OLAP
With the advancements in data accumulation in recent years, spreadsheets have ballooned in both size and volume. Many organizations end up with a bloated number of spreadsheets to track various metrics across multiple departments. They are inherently prone to input error, and understanding the building blocks of formula-driven outputs is difficult for many users.
With an OLAP system, end-users are able to interface more easily with data to produce higher quality outputs that can be used for a wide variety of business needs. Historically, spreadsheets were left to number crunchers and eventually evolved into data sets and tables that held other types of information. Querying excel sheets for data is challenging, and users are essentially left with limited options that consist of pivoting or filtering. This made the data come across as almost secretive in an organization, putting data crunchers in the awkward position of a data translator, a position for which they were rarely prepared.
At its core, an OLAP system is able to aggregate data from a data warehouse, which often is comprised of varying file types. The data can be captured and queried with relative ease. This is in direct contrast with an excel sheet, which is incapable of interpreting data from various sources, and all data must be manually input or linked to other excel files, a time-consuming process to say the least. Writing scripts to bypass this in excel is challenging and requires extreme attention.
Finally, web-based OLAP systems can be accessed on a variety of devices across multiple business locations, making them ideal for growing or fragmented operations.
Learn How Datarails Can Enhance Your Organization
Datarails is a flexible financial solution that can fundamentally change how your organization uses and performs analytics. With Datarails, financial processes can be completed in a fraction of the time it once took, all without you needing to leave the familiar environment of Microsoft Excel. The software allows you to transform tedious, labor-intensive processes into coherent, simple ones within days.
Learn more about how Datarails CPM software can help your company >>