Click for Takeaways: Financial Report Template
- Planning alignment is still rare: Only 3% of companies have strategic, operational, and financial planning processes that are fully aligned and integrated. A standardized financial report template is the first step toward closing that gap.
- Better reporting has a measurable payoff: High-quality FP&A can improve decision outcomes by up to 1% of total sales. The financial reporting template a team uses directly shapes the quality of the decisions it supports.
- AI is reshaping how finance teams report: 72% of finance leaders now use AI tools, more than double the 34% reported the year before. Financial reporting is moving from manual assembly toward automated, AI-assisted analysis.
- CFOs are moving fast: 44% of CFOs used generative AI for five or more use cases in 2025, up from 7% the previous year. Static financial report templates still have a role, but the teams pulling ahead are pairing them with connected platforms.
A financial report template gives finance teams a consistent structure for presenting revenue, expenses, assets, liabilities, and cash flow, without rebuilding the layout every reporting cycle.
The right template standardizes numbers, ensures reliable period-over-period comparisons, and saves hours of formatting each month.
Below is a free, six-tab financial report template for Excel and Google Sheets, pre-filled with sample data you can clear and replace with your own.
Beyond the download, you’ll find a breakdown of what every financial report template should include, how the three core financial statements fit together, how to package reports differently for boards, management, investors, and department heads, and where static templates hit their limits as financial reporting scales.
What Is a Financial Report Template?
A financial report template is a pre-built spreadsheet layout that standardizes how a company presents its financial data. It defines the structure, line items, and formulas so the finance team doesn’t rebuild the report from scratch every month.
At its simplest, a template is a single-page summary of revenue and expenses. At its most useful, it’s a multi-tab workbook covering all three core financial statements (income statement, balance sheet, and cash flow), a KPI dashboard, and an executive summary with variance analysis. The downloadable template included later in this post is the latter.
Templates serve two jobs. First, they enforce consistency. When every reporting period follows the same financial report format, month-over-month and year-over-year comparisons become reliable. Second, they save time. Instead of designing a new layout each cycle, the finance team updates the numbers and focuses on what those numbers mean.
A strong template also makes compliance easier. When the structure follows GAAP conventions, the underlying statements stay audit-ready without extra reformatting. That matters whether the audience is internal leadership, external investors, or the company’s auditors.
What Should a Financial Report Template Include?
A professional financial report template should cover five core sections. Together, they give any stakeholder a complete picture of where the business stands financially.
Income Statement (P&L)
Revenue, cost of goods sold, gross profit, operating expenses by category, EBITDA, and net income. Include a budget-vs-actual column with variance so the reader sees where the business landed relative to the plan.
Balance Sheet
Assets (current and non-current), liabilities (current and long-term), and shareholders’ equity. Presented as month-end snapshots so leadership can track how balances shift across the year.
Cash Flow Statement
Operating, investing, and financing activities. This is the bridge between the income statement and the balance sheet. It answers the question the P&L alone can’t: where did the cash actually go?
KPI Dashboard
Gross margin, operating margin, current ratio, quick ratio, revenue growth rate, and any other ratios the business tracks. Auto-calculated from the financial statements so the numbers stay in sync.
Executive Summary
A single-page snapshot with the key metrics from each statement, plus space for management commentary. This is where the finance team explains what happened, why it happened, and what it means going forward. It’s the page the CEO reads first and sometimes the only page the board reads at all.
The downloadable financial report template below covers all five.
The Three Core Financial Reports and the Template for Each
Every financial report template is built around three statements. Each one answers a different question about the business. Together, they form the foundation of any monthly, quarterly, or annual financial report template.
Balance Sheet
A balance sheet is a snapshot of what a company owns, what it owes, and what’s left for shareholders at a specific point in time. It follows a simple equation: assets = liabilities + equity.
The standard structure breaks into current assets (cash, receivables, inventory), non-current assets (property, equipment, intangible assets), current liabilities (payables, short-term debt), long-term liabilities (loans, lease obligations), and shareholders’ equity.
In the downloadable template, the Balance Sheet tab shows 12 monthly snapshots, allowing the reader to track how balances shift throughout the fiscal year.
Profit and Loss (Income) Statement
A profit and loss report measures financial performance over a period. It starts with revenue at the top and works down through cost of goods sold, gross profit, operating expenses, EBITDA, and net income at the bottom.
The template’s Income Statement tab breaks this out monthly with a YTD column and a budget-vs-actual variance section so the reader can see where results diverged from plan.
P&L structures vary by industry. A SaaS company’s cost of goods sold looks different from a manufacturer’s. For companies with a manufacturing component, the COGS manufactured template provides a more detailed cost breakdown.
Cash Flow Statement
A cash flow report tracks how cash moves in and out of the business across three categories: operating activities (cash generated by day-to-day operations), investing activities (capital expenditures, asset purchases), and financing activities (debt, equity, dividends).
The Cash Flow tab in the template auto-calculates from the Income Statement and Balance Sheet tabs, so the numbers stay connected without manual rekeying. This matters because profitability and cash position are different things.
A company can post a high net income and still run short on cash if receivables stretch, inventory builds, or capex spikes. For teams that want to model future cash positions, the cash flow forecast template extends this view into the future.
Download Our Free Financial Report Template for Excel and Google Sheets
This financial report template is a six-tab Excel workbook that also works in Google Sheets. It’s designed for mid-market finance teams that need a complete monthly reporting package they can start using immediately.
What’s Inside
The template includes an Instructions tab, Income Statement, Balance Sheet, Cash Flow Statement, KPI Dashboard, and Executive Summary.
Every tab is pre-filled with 12 months of sample data for a fictional company (Acme Corp, ~$15M annual revenue) so you can see how the numbers flow before replacing them with your own.
The Income Statement and Balance Sheet tabs are input sheets. The Cash Flow, KPI Dashboard, and Executive Summary tabs pull from them automatically. Update the inputs and the downstream tabs, and recalculate without manual rekeying.
How to Adapt It
Start by mapping the line items to your own chart of accounts. The template uses a general mid-market structure, but most companies will need to adjust operating expense categories, add or remove revenue lines, or modify the KPI formulas to reflect the ratios their leadership team actually tracks.
The KPI Dashboard covers gross margin, operating margin, current ratio, quick ratio, and revenue growth out of the box. For deeper ratio coverage, the 5 key financial ratios template adds profitability, leverage, and efficiency metrics that pair well with this workbook.
Both the blank structure and the filled financial report example are included in the same file. Clear the sample data when you’re ready to use it live, or keep it as a reference while you build out your own numbers. For more downloadable workbooks across budgeting, forecasting, and closing, visit the free Excel templates library.
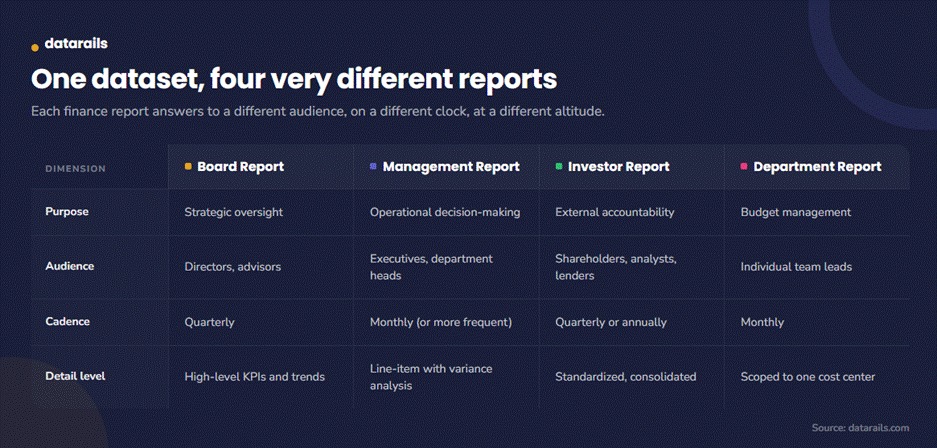
Financial Report Templates By Type: Board, Management, Investor, and Department Reports
A single financial report template works until the company starts reporting to multiple audiences. At that point, the same underlying data needs different packaging depending on who’s reading it and what decisions they’re making.
Board Reports
A board report template is high-level and strategic. Board members don’t need every line item. They need trends, key risks, and enough context to ask the right questions. The typical cadence is quarterly, and the format leans heavily on the KPI dashboard and executive summary rather than the full financial statements.
Focus on revenue trajectory, margin trends, cash runway, and any material variances from the annual plan. Keep it to a few pages. If a board member has to dig through 15 tabs to find the number that matters, the report isn’t doing its job.
Management (Internal) Reports
Internal management reporting runs on operational detail. This is where department-level budget variance analysis lives, with line-by-line comparisons of actuals to budget and prior periods. The cadence is at least monthly, sometimes weekly for fast-moving teams.
A good management report template includes everything in the downloadable template above, plus a layer of commentary explaining the variances. The numbers tell leadership what happened. The commentary tells them why.
Investor Reports
Investor reports are standardized and compliance-aware. They benchmark results against prior periods and any guidance the company has issued. For multi-entity companies, this means consolidated financial statements that roll up subsidiaries into a single set of numbers.
The format matters here more than in any other report type. Investors compare companies side by side, so the structure needs to follow recognized standards and present data the same way every period.
Department and Cost-Center Reports
A department report scopes the financials to a single team’s budget and spend. The marketing director sees marketing line items. The engineering lead sees engineering. Neither needs to see the full company P&L to manage their own resources.
This is the leanest report type. A few rows of budget vs. actual, a variance column, and a short commentary section. The value is accountability without information overload.
How Report Types Compare
How to Build a Financial Report That Actually Gets Used
The most common failure in financial reporting is a report that gets built on time, sent out, and ignored.
These five steps help close the gap between producing reports and producing reports that drive decisions.
Start with the Audience
Who reads this report, and what decisions does it support?
A monthly financial report template for the CFO looks different from one designed for department heads. Define the audience before choosing the structure, the level of detail, and the metrics that matter. The comparison table in the previous section is a good starting point.
Standardize the Format
Lock the layout so month-over-month and year-over-year comparisons work without manual reformatting.
When every cycle follows the same financial report format, anomalies surface faster because the reader knows where to look. According to Gartner, only 3% of companies have strategic, operational, and financial planning processes that are fully aligned and integrated. A consistent reporting structure is one of the simplest ways to move toward that alignment.
Automate Data Collection
The biggest time sink in financial reporting is not the analysis. It’s pulling numbers from the ERP, CRM, HRIS, and bank feeds into one place. Every hour spent copying and reconciling data is an hour not spent interpreting what the data means. This is where static templates hit their ceiling, a point covered in the next section.
Add Context
Numbers without narrative are noise. Include variance commentary, trend callouts, and forward-looking notes in the executive summary.
Financial dashboards help visualize the story, but the written commentary is what tells leadership why revenue dipped in March or why operating expenses ran ahead of plan in Q2.
Set a Cadence and Protect It
Monthly reporting at a minimum. Board and investor reports quarterly.
The cadence matters less than the consistency. A month-end reporting guide can help formalize the timeline, assign ownership to each section, and keep the process from slipping.
Where Static Financial Report Templates Break Down
A spreadsheet-based financial report template works well for a single entity with a stable chart of accounts and a small finance team. But when faced with these four conditions, it starts to strain.
Multiple Entities or Departments
When the company adds a second entity, a new division, or an acquisition, the template needs to be duplicated and reconciled.
Copy-pasting across workbooks introduces version control problems and formula drift. One broken link between tabs can cascade through the entire reporting package without anyone noticing until the board meeting.
Growing Data Volume
As the company adds systems, a new CRM, a second payroll provider, and a billing platform for a new product line, manually pulling and reconciling data into the template takes longer each month.
The month-end close checklist template helps organize the process, but the underlying problem is the number of sources feeding into the report.
Stakeholder Variety
When the board, management, investors, and department heads all need different cuts of the same data, maintaining parallel templates becomes a second job. The finance team ends up spending more time reformatting than analyzing.
Speed Expectations
Leadership wants numbers faster. Manually updating a template by the 15th doesn’t cut it when the CEO asks for a flash report on the 3rd. According to Gartner, high-quality FP&A can improve decision outcomes by up to 1% of total sales. That improvement only materializes if the numbers arrive in time to influence the decision.
None of this means Excel is the problem. Excel is where finance teams do their best work. The problem is everything that happens before the numbers land in the spreadsheet: data collection, reconciliation, and version control.
That’s the layer that needs to change. For teams evaluating their options, a broader look at FP&A software helps frame what “changing that layer” actually looks like in practice.
How Datarails Turns a Financial Report Template Into a Live, Always-Current Report
The template above gives finance teams a solid structure. Datarails FP&A gives that structure a live data layer underneath it, so the numbers update automatically instead of waiting on manual pulls each month.
Automated Data Consolidation
Datarails connects to 600+ data sources, including ERPs, CRMs, HRIS platforms, billing systems, and bank feeds, through pre-built integrations.
Every source flows into a single consolidated data layer. No more copying numbers out of five systems into one spreadsheet. No more reconciling mismatched exports. The data lands in one place, mapped and ready.
Excel-Native Workflow
Finance teams keep working in Excel. Their models, formulas, and report layouts stay intact. Datarails adds the data pipeline and automation underneath without forcing anyone into a new interface or a rigid template they can’t modify.
The finance team controls the structure. Datarails handles the plumbing.
AI-Powered Reporting and Analysis
Datarails AI is built around three Agents. The Reporting Agent analyzes actuals and surfaces the story behind the numbers, flagging variances and trends the finance team might otherwise spend hours finding manually.
The Planning Agent handles ad-hoc forecasting and scenario modeling without requiring anyone to rebuild a model from scratch. The Strategy Agent provides big-picture trade-offs and recommendations that connect financial results to business decisions.
On top of the Agents, Insights delivers configurable automated summaries tied to the metrics that matter most to each stakeholder. Storyboards generate AI-powered financial narratives and presentations in two clicks, turning a reporting package into a board-ready deck without a manual design step.
Why This Matters Now
The shift toward AI-assisted financial reporting is accelerating.
According to Protiviti’s 2025 Global Finance Trends Survey, 72% of finance leaders now use AI tools, more than double the 34% reported the year before. A McKinsey survey of 102 CFOs found that 44% used generative AI for five or more use cases in 2025, up from 7% the previous year. And according to PwC’s 2024 Finance Effectiveness Benchmarking Report, leading finance teams have reduced their costs as a percentage of revenue by nearly 25% by shifting time from automatable tasks to insight generation.
A financial report template gets the structure right. Datarails keeps it current, connected, and useful without asking finance teams to give up the tool they already know.
Stop Rebuilding Reports and Start Using Them
A good financial report template solves the structure problem. It standardizes the layout, enforces consistency across reporting periods, and gives every stakeholder a clear view of revenue, expenses, assets, liabilities, and cash flow. The free template above covers that ground.
What it can’t solve on its own is the data problem: the manual collection, the reconciliation across systems, and the version control as the company grows. That’s the layer where static templates hit their ceiling and a connected platform picks up.
Turn Your Financial Reports Into a Live Source of Truth
Datarails connects your ERP, CRM, and HRIS into one platform, automates data consolidation, and layers in AI-powered reporting and analysis. All without leaving Excel.
Financial Report Template FAQs
A financial report template is a pre-built spreadsheet layout that standardizes how a company presents its financial data. It typically includes an income statement, balance sheet, cash flow statement, and key performance indicators in a consistent financial report format that can be reused each reporting period.
Yes. The financial report template included on this page is free, works in both Excel and Google Sheets, and includes six tabs: Instructions, Income Statement, Balance Sheet, Cash Flow, KPI Dashboard, and Executive Summary. It comes pre-filled with sample data you can clear and replace with your own numbers.
A financial statement is one component, like an income statement, balance sheet, or cash flow statement. A financial report is the broader package that combines multiple statements with KPI tracking, variance analysis, and management commentary. Most financial report templates include all three statements plus a summary layer.
A management report template focuses on operational detail with department-level variance analysis, typically monthly. A board report template is high-level and strategic, focused on trends and key risks, typically quarterly.
An investor report is standardized and compliance-aware, benchmarked against prior periods and guidance. All three pull from the same underlying financial data but package it differently depending on the audience.
Yes. The financial report template on this page is built entirely in Excel with no add-ins or external software required. Excel handles the structure, formulas, and formatting.
The limitation shows up in data collection. As the company grows and pulls from more systems, manually feeding data into the template takes progressively longer. That’s the point where pairing Excel with a connected platform automates the data layer without replacing the spreadsheet.
When the company adds entities, departments, or data sources faster than one person can manually reconcile each month. Or when stakeholders start needing different financial report formats (board vs. management vs. investor) from the same data set.
A static financial reporting template still works as the presentation layer, but the data feeding it needs to come from a consolidated, automated source rather than manual exports.